RESEARCH/REVIEW ARTICLE
Seafloor expression and shallow structure of a fold-and-thrust system, Isfjorden, west Spitsbergen
Maria Blinova,1 Jan Inge Faleide,2 Roy H. Gabrielsen2
& Rolf Mjelde1
1 Department of Earth Science, University of Bergen, Allégaten 41, NO-5007 Bergen, Norway
2 Department of Geosciences, University of Oslo, P.O. Box 1047 Blindern, NO-0316 Oslo, Norway
Abstract
A detailed map of the structure of the west Spitsbergen fold-and-thrust belt in the Isfjorden area, Spitsbergen, is presented. The map was constructed from a dense grid of two-dimensional multichannel reflection seismic and bathymetric data. Joint interpretation of two data sets allowed a comparison of tectonic structures detected along the uppermost parts of the seismic sections and those reflected in the morphology of the seafloor. Three major, predominantly north-west–south-east striking faults were identified. The westernmost fault (T1) is a hinterland-directed (most likely out of sequence) thrust, while the central and easternmost faults (T2 and T3) are foreland-directed (in-sequence thrusts). The thrusts divide Isfjorden into three subareas. Subarea 1 is bounded by thrust faults T1 and T2 and comprises Tertiary rocks surrounded by Jurassic–Cretaceous strata. The structural signature of Subarea 1 is that of a system of hinterland- and foreland-directed thrust faults, resulting in a seafloor relief characterized by parallel ridges and troughs. Subarea 2 is limited by thrust faults T2 and T3 and shows Jurassic–Cretaceous outcrops on the seafloor. Subarea 3 is situated east of the main thrust fault T3 and mainly involves outcrops of Triassic–Jurassic rocks. Together, Subareas 2 and 3 are dominated by foreland-directed, north-west–south-east and NNW–SSE-striking thrusts that are hardly detectable in bathymetric data.
Keywords
Svalbard; Isfjorden; west Spitsbergen fold-and-thrust belt; seismic interpretation; seafloor morphology; shallow structures.
Correspondence
Maria Blinova, Department of Earth Science, University of Bergen, Allégaten 41, NO-5007 Bergen, Norway.
E-mail: maria.blinova@gmail.com
(Published: 5 September 2012)
Polar Research 2012. © 2012 M. Blinova et al. This is an open-access article distributed under the terms of the Creative Commons Attribution-Noncommercial 3.0 Unported License (http://creativecommons.org/licenses/by-nc/3.0/), permitting all non-commercial use, distribution, and reproduction in any medium, provided the original work is properly cited.
Citation: Polar Research 2012, 31, 11209, http://dx.doi.org/10.3402/polar.v31i0.11209
The Svalbard Archipelago is located on the continental shelf of the north-western Barents Sea. The Palaeogene west Spitsbergen fold-and-thrust belt (WSFTB) on the west coast of the main island of Spitsbergen (Fig. 1) developed in response to opening of the Norwegian–Greenland Sea (Talwani & Eldholm 1977; Srivastava 1985; Olesen et al. 2007; Engen et al. 2008; Gaina et al. 2009). The evolution of the WSFTB has been explained as a result of a head-on collision between the Greenland and the Eurasian plates (Lyberis & Manby 1993a, b; Tessensohn & Piepjohn 2000, CASE Team 2001; Saalmann & Thiedig 2002). An alternative hypothesis is that the fold-and-thrust belt reflects the contractional component of strain in a transpressional setting (Harland 1969; Lowell 1972; Faleide et al. 1988; Maher & Craddock 1988). The latter has been supported by analogue modelling performed by Leever and co-workers (Leever, Gabrielsen, Faleide et al. 2011; Leever, Gabrielsen, Sokoutis et al. 2011). Hence, the fold-and-thrust belt was related to the evolution of a dextral transform fault system between Greenland and Svalbard (Harland 1969; Birkenmajer 1972; Srivastava 1978; Birkenmajer 1981; Faleide et al. 1993; Lundin & Dore 2002; Mosar et al. 2002; Faleide et al. 2008; Gaina et al. 2009).
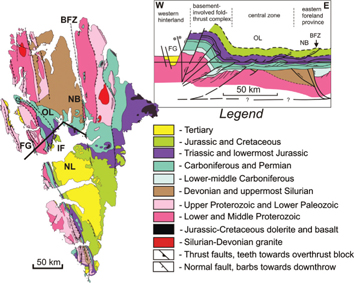
Fig. 1
Geological map of Svalbard (Hjelle 1993) and generalized cross-section along the Isfjorden transect. Abbreviations are as follows: BFZ is the Billefjorden Fault Zone, FG is the Forlandsundet Graben, OL is Oscar II Land, IF is Isfjorden, NB is the Nordfjorden block, and NL is Nordenskiöld Land. The cross-section shows the subdivision of the fold-and-thrust belt from west to east into: the western hinterland, the basement-involving foldthrust complex, a central zone of folding and thrusting and the eastern foreland province (Dallmann et al. 1993; Braathen et al. 1999; Bergh et al. 2000).
A series of detailed field studies of the fold-and-thrust belt in the Isfjorden area has been carried out (Maher et al. 1989; Andresen et al. 1992; Braathen et al. 1995; Braathen & Bergh 1995; Braathen et al. 1999; CASE Team 2001; Piepjohn & von Gosen 2001; Tessensohn 2001; von Gosen et al. 2001), providing a very good foundation for the interpretation of offshore reflection seismic and bathymetric data. An interpretation of the structure of the fold-and-thrust belt based on marine multichannel reflection seismic data from Isfjorden was presented by Nøttvedt (1994). Bergh et al. (1997) compiled a regional structural map of central Spitsbergen based on field and offshore data. They also constructed an offshore geologic and tectonic map of the central part of Isfjorden using 12 multichannel seismic lines crossing the area. This account presents a new and detailed structural map of the Isfjorden area based on a dense grid of multichannel seismic lines and widespread echo sounder coverage.
Isfjorden is the largest fjord in Spitsbergen. It reaches about 100 km inland and is about 20 km wide near the west coast of the island (Fig. 1). The intensity of glacial erosion in Isfjorden reflects the varying mechanical properties of the various lithologies that crop out on the seafloor, allowing identification and mapping of tectonic units based on seafloor relief. By comparing bathymetric observations with the shallow parts of reflection seismic sections and structural features identified by onshore structural mapping, a structural map of the upper part of the thrust system can be constructed. Marine acoustic records in the fjord revealed that the bedrocks in the area are covered by 5–20 m (5–20 ms two-way travel time) of unconsolidated mud (Elverhøi et al. 1983; Germond 2005). Generally, these sediments drape the surface of the underlying rocks, and do not obscure its relief.
The main goal of this study is the construction of a detailed map and a description of the tectonic features of the shallow part of the fold-and-thrust belt in Isfjorden based on compilation of two different sets of data: multibeam echo sounder data and two-dimensional multichannel seismic data. Linking shallow structures to deeper ones is beyond the scope of this article and will be described in a separate publication. The high-resolution bathymetric chart reveals tectonic features on the seafloor while multichannel seismic data provides images of the subsurface tectonic structures. Integration and interpretation of these two independent data sets provides a much clearer understanding of the WSFTB in relation to transpressional deformation along the western coast of Spitsbergen.
Geological setting
Spitsbergen comprises strata of Precambrian to Recent age deformed in various tectonic regimes since the Palaeozoic era (Fig. 1; Dallmann 2007). The construction of an almost continuous late Palaeozoic to early Tertiary sedimentary succession took place due to submergence of Svalbard during most of its geological evolution (Hjelle 1993). Igneous and metamorphic basement rocks on Spitsbergen are Precambrian to Silurian in age and were intensely deformed during the Caledonian Orogeny (Harland 1959, 1985; Birkenmajer 1975; Ohta 1992; Fossen et al. 2008; Gee et al. 2008). Subsequently, the Svalbard area underwent several periods of erosion, sedimentation and tectonism. Extensive denudation of the Caledonian mountain range in the Devonian period is reflected by a sequence of terrestrial sandstones up to 8 km thick preserved in down-faulted crustal blocks (Friend & Moody-Stuart 1972; Murashov & Mokin 1979). In the late Devonian these sediments were folded and faulted in the Svalbardian Event (Vogt 1928, 1929; Dallmann 1999; Bergh et al. 2011), while the period from the late Carboniferous to middle Permian times was characterized by deposition of limestone, dolomite and the evaporites gypsum and anhydrite (Worsley & Aga 1986; Dallmann 1999; Worsley 2008). During the Mesozoic a thick succession consisting predominantly of shales, siltstones and sandstones was deposited in conditions influenced by pronounced fluctuations in sea level. In the latest Jurassic to early Cretaceous, igneous activity in the Spitsbergen area resulted in intrusions of dolerite dykes and sills within the sedimentary sequence (Worsley & Aga 1986; Hjelle 1993; Dallmann 1999).
During the formation of the fold-and-thrust belt, strata along the west coast of Spitsbergen underwent uplift and erosion while a foreland basin (the Central Tertiary Basin) developed in the central part of the island, south of Isfjorden (Steel et al. 1985; Worsley & Aga 1986; Dallmann et al. 1993). Eastward propagation of the fold-and-thrust belt occurred above basal decollements localized in Permian gypsum and Middle Triassic and Upper Jurassic shales (Fig. 1; Braathen et al. 1995; Braathen & Bergh 1995; Bergh et al. 1997; Piepjohn & von Gosen 2001). Since the Oligocene a tensional tectonic regime has prevailed between Svalbard and Greenland (magnetic anomaly 13) following a plate-tectonic reorganization of the North Atlantic (Talwani & Eldholm 1977; Tessensohn & Piepjohn 2000; Engen et al. 2008; Faleide et al. 2008) and the WSFTB has been inactive (Faleide et al. 1993).
Data
The geophysical data used in the present study (Fig. 2) includes multibeam echo sounding and two-dimensional multichannel seismic profiles. The bathymetrical data were collected during an acoustic survey carried out by the University of Bergen in 2004 using a Multibeam Echo Sounder EM 1002 (Kongsberg Maritime, Horten, Norway). The equipment gives high-resolution bathymetric data at water depths of 10–1000 m. The acoustic data acquired were exported as a xyz grid with 30-m cell size for two- and three-dimensional visualization using ArcGis and Fledremaus software (Germond 2005).
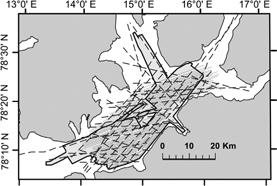
Fig. 2
Survey map, Isfjorden. Thin solid lines indicate the Svalex surveys of 2004, 2005, 2006 and 2007. The dashed lines show the Statoil surveys ST8815 and ST8515. The boundary of multibeam echo sounder coverage is indicated with the grey ploygon outlined in black.
The two-dimensional multichannel seismic lines were acquired by the University of Bergen during the annual Svalex field course in 2004, 2005, 2006 and 2007 (Mjelde 2004, 2008). The data were acquired with 50 m shot intervals and a 3000-m streamer along ca. 1850 km of seismic lines with 500 m separation. The petroleum company Statoil acquired 1660 km of multichannel seismic data in 1985 and 1988 using 2400 and 3000 m long streamers, respectively, and 25 m between shot-points.
Interpretation
The dense grid of multichannel seismic data and multibeam echo sounder data have been used for correlation of seafloor morphology and tectonic structures in the shallow part of the fold-and-thrust belt in Isfjorden. The resolution of the multichannel seismic data enables detailed interpretation of tectonic structures within the uppermost parts (1 second two-way travel time) of the sections. The seafloor reflection along some survey lines has been suppressed during processing of the seismic data.
Correlation of seismic units with the stratigraphy as established from onshore studies of the Isfjorden area was based on Ohta et al. (1992), Nøttvedt (1994), Bergh et al. (1997) and Dallmann (1999). A typical section and its stratigraphic correlation are shown in Fig. 3. It displays the lowermost angular unconformity separating chaotic, discontinuous reflections and strong continuous reflections that corresponds to the break between Devonian(?) and Carboniferous–Permian units. Weak discontinuous reflections of Sassendalen Group shale are overlain by the Kapp Toscana sandstones of higher reflectivity and typical seismic character of the Triassic–lowermost Jurassic strata. The low velocity shales of the Janusfjellet Subgroup and overlying high velocity sandstones of the Helvetiafjellet Formation produce a pronounced impedance contrast and a strong reflection. Finally, the base of the Tertiary sequence is defined as a thin transparent unit overlain by a sequence of strong, continuous reflections. The principal decollements that can be correlated over longer distances along multichannel seismic sections are also shown in Fig. 3.
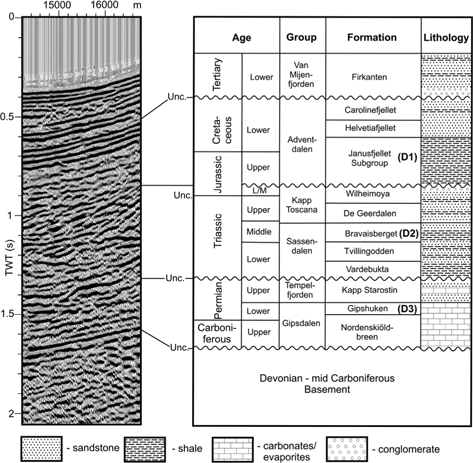
Fig. 3
Correlation diagram of stratigraphic and seismic units in section ST8815-227. TWT (s) is 1 second two-way travel time. Unconformity is abbreviated to Unc. D1 and D2 are decollements in organic-rich (black) shales of the Janusfjellet Subgroup and Sassendalen Group (Bravaisbeget Formation). D3 is a decollement in gypsum of the Gipshuken Formation. Correlation and lithology are based on stratigraphical tables published by Ohta et al. (1992), Nøttvedt (1994), Bergh et al. (1997) and Dallmann (1999).
Key transect
An example of the seismic image of the Isfjorden section of the WSFTB and our interpretation is shown in a section along lines ST8815-222 and ST8515-121 (Fig. 4). The section allows the identification of continuous reflectors that separate Carboniferous–Permian, Triassic–lowermost Jurassic, Jurassic–Lower Cretaceous and Tertiary sequences. The sediments dip to the west so that the rocks cropping out on the seafloor become older to the east.
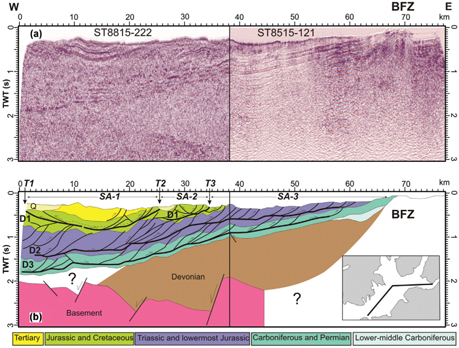
Fig. 4
(a) Seismic section along lines ST8815-222 and ST8515-121 and (b) its interpretation. TWT (s) is 1 second two-way travel time. The Billefjorden Fault Zone is abbreviated to BFZ and Quaternary to Q. T1, T2 and T3 are major thrust faults. SA-1, SA-2 and SA-3 denote the defined three subareas. Thick lines indicate decollements D1, D2 and D3. Thin lines indicate thrust faults. The dashed line within the interpreted Jurassic–Cretaceous strata corresponds to the base of Helvetiafjellet Formation.
Two principal types of contractional tectonic structures have been observed in the field and described as “decollements” and “thrusts”. The term “decollement” is used for faults that are basal and layer-parallel, while “thrust” corresponds to low-angle faults cutting bedding.
Three major thrusts with a characteristic top to the east displacements are evident, but local (probably out of sequence) back-thrusts are identified in the western part of the sections adjacent to the basement-involving fold-and-thrust complex (0–10 km along the section in Fig. 4). The thrusting caused easterly rotation of the strata and the formation of a syncline in the shallower stratigraphic units encompassing the Central Tertiary Basin.
Three decollements are clearly visible in the transect (Fig. 4). The uppermost and intermediate decollements are located within Upper Jurassic and Middle Triassic black shales, respectively, whereas the lowermost is developed in Permian evaporite. Two of the major thrusts (T2 and T3 in Fig. 4b) are foreland-directed and emerge on the seafloor. The thrusts are connected with the uppermost decollement. Thrust T1 also occurs on the seafloor. It is, however, hinterland-directed, belongs to the uppermost decollement (D1) and is probably an out of sequence structure. Thus, T2 defines the frontal part, while T1 defines the trailing edge of the nappe above the upper decollement (D1). T1 is the most westerly major thrust fault that can be identified in the seismic lines acquired. The deepest decollement (D3) can be identified along the full length of the section, but terminates either as a blind thrust fault within the Permo-Carboniferous sequence or merges up-section with the intermediate decollement (D2) near the eastern end of the section (Fig. 4b). Thrusts T1, T2 and T3 separate regions of different tectonic/structural styles on the seafloor and therefore delineate three tectonic subareas (Fig. 4b). Subarea 1 is bounded by T1 to the west and T2 to the east, both of which emerge from the same decollement (D1) within the Janusfjellet Subgroup. Subarea 1 therefore contains Jurassic, Lower Cretaceous and Tertiary strata. Subarea 2 is bounded to the east by fault T3 that emerges from the decollement at the same stratigraphic layer as beneath Subarea 1. However, this subarea is dominated by rocks of Janusfjellet Subgroup cropping out on the seafloor. Subarea 3 is an area on the seafloor where mainly Triassic–Lower Jurassic strata crop out, surrounded by thin units of Jurassic–Cretaceous and Carboniferous–Permian strata to the east and west, respectively. A correlation of the lithological boundaries and tectonic structures defined offshore with the onshore geology is shown in Fig. 5. According to the map, thrust fault T2 can be equated with the Fuglefjellet Thrust at Grumantbyen. This fault cuts strata in the Central Tertiary Basin along the southern shore of Isfjorden (Dallmann et al. 1993).
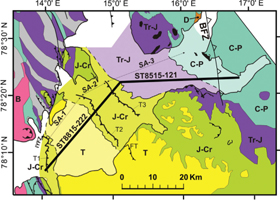
Fig. 5
Geological map of the Isfjorden area. Geological boundaries beneath Isfjorden are inferred from multichannel seismic data (see Fig. 3). The interpretation of the seismic section along lines ST8815-222 and ST8515-121 is shown in Fig. 4. Grey areas on the map are glacial cover onshore and mark the absence of data offshore. Abbreviations are as follows: BFZ is the Billefjorden Fault Zone, IYFZ is the Isfjorden–Ymerbukta Fault Zone, T is Tertiary, J-Cr is Jurassic and Cretaceous, Tr-J is Triassic and lowermost Jurassic, C-P is Carboniferous and Permian, B is Basement and FT is the Fuglefjellet Thrust at Grumantbyen. Major thrust faults are denoted T1, T2 and T3. SA-1, SA-2 and SA-3 are tectonic subareas. The onshore part of the geological map is compiled from maps published by the Norwegian Polar Institute (Major & Nagy 1972; Lauritzen et al. 1989; Ohta et al. 1992; Dallmann et al. 1993; Major et al. 2000; Bergh et al. 2003; Dallmann et al. 2009).
Multichannel seismic data
The inferred seafloor reflector in all of the multichannel seismic sections was used to produce a bathymetric map (Fig. 6). The seafloor displays striking morphological features in Subareas 1 and 2. The eastern boundaries of both Subareas 1 and 2 are marked by long, continuous escarpments. Internally, Subarea 1 is characterized by an undulating seafloor with the deepest part situated close to the shore of Oscar II Land. Some of these features can be directly linked to compressional structures, but judging by the bathymetry they are probably discontinuous. In contrast, Subarea 2 features persistent escarpments, inferred to mark outcropping faults. The seafloor in Subarea 3 is smoother than in Subareas 1 and 2, although several escarpments marking minor thrusts (Fig. 6) can be recognized. These observations suggest that the decollements and thrust sheets evident in seismic sections are also expressed by the relief of the seafloor.
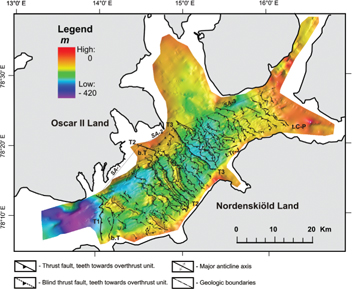
Fig. 6
Seafloor morphology derived from interpretation of the two-dimensional multichannel seismic data. The interpretation of the shallow tectonic structures in Isfjorden projected to the seafloor morphology map is derived from the seismic data. Major thrust faults are denoted T1, T2 and T3. The base of the Tertiary horizon is abbreviated to b.T, the top of the Triassic and lowermost Jurassic strata to t. Tr-J and the top of the Carboniferous–Permian strata to t.C-P. SA-1, SA-2 and SA-3 are tectonic subareas bounded by major thrust faults (T1, T2 and T3) marked by heavy lines. Minor thrust faults are shown as thin lines. Solid lines correspond to faults emergent to the sea-surface, whereas dashed lines refer to blind thrusts.
Subarea 1.
The major part of Subarea 1 is occupied by Tertiary rocks surrounded by outcrops of Jurassic–Cretaceous strata (Fig. 5). This subarea is characterized by numerous back thrusts. Good examples of the structural style of Subarea 1 are shown in sections ST8815-222, SV04-4, -7, -19, -27 and SV05-38 in Fig. 7. Profiles shown in Fig. 7b and c are typical of the structural style adjacent to the western boundary of Subarea 1. The major back thrust (fault T1) cuts up-section westwards from the decollement D1 in Upper Jurassic strata. Fault T1 carries another back thrust in its hanging wall, splaying out from the same decollement. The hinterland-directed system also encompasses uplifted snake-head structures in the hanging walls of footwall ramps, fault propagation folds and pop-ups (Fig. 7c–e). The general strike of observed morphological highs and minor thrust faults in the eastern part of the subarea is north-west–south-east.
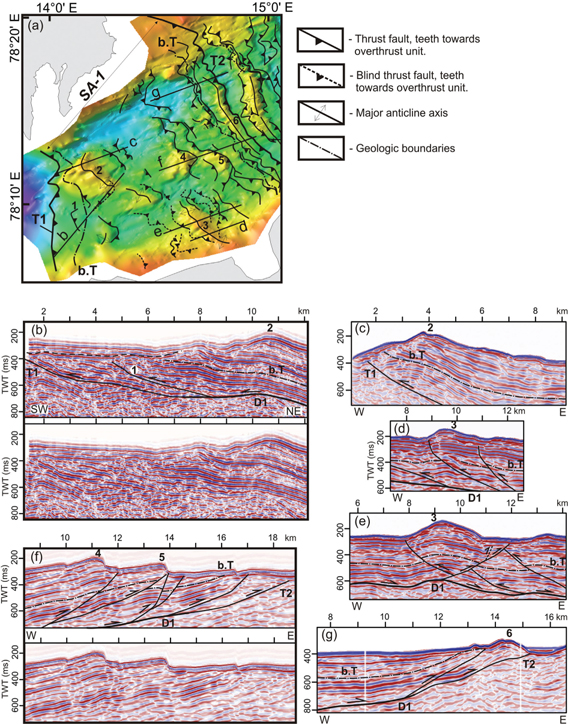
Fig. 7
(a) Detailed map of the seafloor in Subarea 1 (SA-1), with locations of seismic sections and numbered tectonic structures. Examples of interpreted seismic sections are: (b) ST8815-222, (c) SV04-27, (d) SV04-4, (e) SV04-7, (f) SV04-19 and (g) SV05-38. T1 and T2 are major thrust faults. D1 is a decollement and b.T indicates the base of the Tertiary succession. TWT (ms) is 1 second two-way travel time.
The north-eastern boundary of Subarea 1 is defined by the surface limit of foreland-directed thrust fault T2. As seen in Fig. 7f and g this is a thrust system with the geometry of an imbricate fan, the leading edge of which breaches the sub-glacial erosion surface. It includes an anticline (number 6 in Fig. 7g) bounded by thrust T2 to the east, which is identified as a hanging wall fault-propagation fold.
Subarea 2.
The most significant tectonic features of Subarea 2 (Fig. 8a) are the limiting thrust faults T2 to the west and T3 to the east. Both thrust faults branch from decollement D1 that lies within the Upper Jurassic sequence. In the cross-section there is a discontinuity in the decollement in the regional transport direction (20–24 km along the line ST8815-217; Fig. 8b). The discontinuity may be due to the influence of deeper structures in this segment. In general, Subarea 2 has a structural style that is very different from that of Subarea 1. Its south-western border consists of a duplex where the uppermost horse has been exposed and eroded. To the north-east of the duplex, two back thrusts (1 and 4) ramp up from the principal decollement D1, resulting in a topographic high (2) between the two faults. The westernmost part may be a collapsed horse belonging to the duplex. Back-thrusts 1 and 4 and the associated reverse faults 3 and 5 result in local pop-ups. Back thrust 4 is followed to the northeast by other thrust branches (6 and 7) that emerge from the decollement and are associated with subdued seafloor topography. Figure 8c presents an interpretation of the major thrust fault T3 that ramps up steeply from the decollement and produces a laterally extensive escarpment on the sea bed. The north-eastern part of Subarea 2 has the geometry of a foreland-directed, in-sequence thrust system.
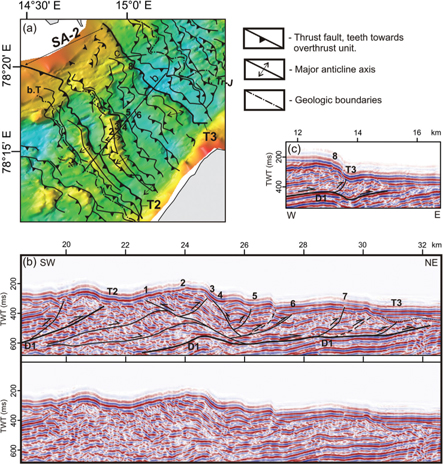
Fig. 8
(a) Detailed map of Subarea 2 (SA-2), with locations of the seismic sections shown in (b) and (c) and identified tectonic structures (numbered). TWT (ms) is 1 second two-way travel time. Examples of interpreted seismic sections are: (b) ST8815-217 and (c) ST8815-125. T2 and T3 are major thrust faults. D1 is a decollement, b.T indicates the base of the Tertiary succession and t. Tr-J indicates the top of the Triassic and lowermost Jurassic strata. Thrust faults marked on (b) with dashed lines are not shown in the map view.
Subarea 3.
In spite of the relatively smooth seafloor of Subarea 3, the underlying thrust system indicates intense deformation in the area (Fig. 9). The faults are easily identified in the seismic data and define a pattern of en echelon thrusts and associated folds (Fig. 9b–d). The seafloor displays ridges and troughs that are sub-parallel to the fault branches and escarpments are probably the result of erosion of fault scarps. Thrusts emerging on the seafloor in this area appear mainly to have evolved above decollement D2 within Middle Triassic strata (Fig. 9b, c). Thrust faults branching off the basal decollement D3 in Permian gypsum are observed only along slivers of Carboniferous–Permian strata cropping out in the easternmost part of the area (Fig. 9d). It is noteworthy that the north-eastern termination of the structures coincides with a wide and continually climbing frontal footwall ramp.
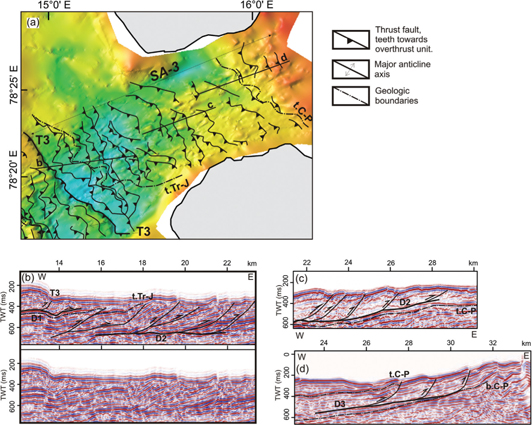
Fig. 9
(a) Map of the tectonic interpretation in Subarea 3 (SA-3), with locations of the seismic sections given in (b), (c) and (d). TWT (ms) is 1 second two-way travel time. Examples of interpreted seismic sections are: (b) ST8815-125, (c) SV06-47 and (d) SV06-51. T3 indicates a major thrust fault, and D1, D2 and D3 are decollements. The top of the Triassic and lowermost Jurassic strata is abbreviated to t. Tr-J, the top of the Carboniferous–Permian strata to t.C-P and the base of the Carboniferous–Permian strata to b.C-P.
Multibeam data
The multibeam echo-sounder survey provides a detailed relief map of the seafloor. This can be used to identify the main tectonic structures as reflected in the submarine morphology.
The tectonic structures based on the submarine relief in Isfjorden are shown in Fig. 10. In Subarea 1 we can observe two groups of major topographical highs: one group strikes south-east–north-west (marked by axes 1–3) and the other strikes in the NNW–SSE direction (4–6). Escarpments are interpreted as thrust faults cropping out on the seafloor (groups 7 and 8). Subarea 3 is characterized by relatively low relief. Nevertheless, two groups of the thrust traces can be recognized on the seafloor. As in the case for the Subarea 1, these two groups also differ in strike (Fig. 10). Areas of uneven topography and lack of along-strike continuity may reflect the sheet-like geometry of some folds and thrust units and perhaps the existence of transport-parallel ramps.
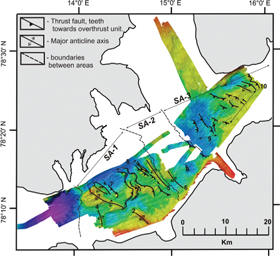
Fig. 10
The seafloor of Isfjorden as imaged by a multibeam echo sounder. Subareas 1, 2 and 3 are denoted SA-1, SA-2 and SA-3.
Discussion and conclusions
The results from multichannel seismic and multibeam echo sounder surveys have been plotted together in order to compare the interpretation of the two data sets. A combined geologic and tectonic map was constructed displaying features derived from the multibeam data and multichannel seismic data, including onshore structures based on published data (Fig. 11).
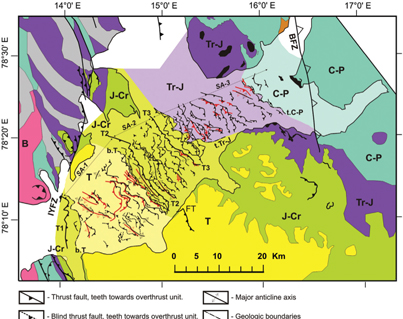
Fig. 11
Geological and tectonic map of the Isfjorden area. The structures beneath the fjord are inferred from multi-channel seismic and multibeam echo sounder surveys (see Fig. 2). The red symbols are based on the interpretation of seafloor morphology and black symbols are based on multi-channel seismic data. Grey areas on the map are either covered or lack data. Abbreviations are as follows: T is Tertiary, J-Cr is Jurassic and Cretaceous, Tr-J is Triassic and lowermost Jurassic, C-P is Carboniferous and Permian, B is Basement, BFZ is the Billefjorden Fault Zone, IYFZ is the Isfjorden–Ymerbukta Fault Zone and FT is the Fuglefjellet Thrust at Grumantbyen. T1, T2 and T3 denote major thrust faults. SA-1, SA-2 and SA-3 indicate Subareas 1, 2 and 3.
The general grain of the seafloor reflects the tectonic structures observed within the upper part of the sedimentary sequence. However, structures which extend to the seafloor are not always reflected in the bathymetry. For example, the tectonic map of Subarea 1 shows a good match between the interpretations of the two data sets, whereas Subarea 3 shows that most of the structures identified in the upper sedimentary section that crop out on the seafloor are not reflected in the bathymetry. The differences in correspondence of the subsurface structures and bathymetry in Subareas 1 and 3 could be related to lithological differences in the rocks that crop out on the seafloor. Therefore, the Tertiary and the Lower Cretaceous (Helvetiafjellet Formation) sandstones were probably more resistant to erosion than the Triassic–Jurassic shale sequences. The data coverage by the multibeam echo sounder data in Subarea 2 was not extensive enough to permit a reliable interpretation of the tectonic structures. Some of the structures that are prominent in multibeam data represent minor structures in seismic sections. For example, a thrust fault was not recognized in the seismic section shown in Fig. 7f at 10 km, but it causes a pronounced feature in the bathymetry (Fig. 10). Thus, identification of geological structures in complementary multichannel seismic and multibeam data is advantageous.
Comparison of the results with geological observations onshore demonstrates a continuation of lithological boundaries and tectonic structures across the floor of Isfjorden (Fig. 11). The Fuglefjellet Thrust at Grumantbyen corresponds with the major thrust fault T2 that crops out on the floor of Isfjorden. Detailed seismic mapping of the shallow structures shows that most of the structures beneath Isfjorden are dominated by foreland-directed, in-sequence thrusts and related folds with north-west–south-east and NNW–SSE strikes. Furthermore, there is a significant component of hinterland-directed, out-of-sequence thrusting in some zones, particularly in the southern part of Subarea 1, in accord with onshore observations in the western part of Nordenskiöld Land (Ohta et al. 1992).
The new geologic and tectonic map presented here refines the previous interpretation of geological boundaries and structures in Isfjorden published by Bergh et al. (1997). The Central Tertiary Basin occupies a smaller area beneath Isfjorden than previously believed. The structural architecture of the WSFTB beneath Isfjorden is similar to that seen onshore and some of the principal thrusts can be traced beneath it.
The detailed map of the shallow structures beneath Isfjorden may help in understanding the origin of the WSFTB. The geometry of the structures observed in the Isfjorden area is in accordance with results of analogue tectonic modelling, supporting the hypothesis that the WSFTB was related to low-angle transpression (Leever, Gabrielsen, Faleide et al. 2011; Leever, Gabrielsen Sokoutis et al. 2011).
Acknowledgements
We are grateful to the Norwegian Petroleum Directorate (NPD) for financial support. In particular, we thank Harald Brekke (NPD) for his assistance. We also would like to thank Statoil, participants of the Svalex expeditions, the crew of the RV Håkon Mosby and engineers from the Department of Earth Science at the University of Bergen (UB) for supplying geophysical data. Furthermore, we thank the Russian marine geological prospecting company Sevmorgeo for help with seismic data processing. We acknowledge the help of Ole Meyer and Bent Ole Ruud (UB) in analysing seismic and navigational data, Haflidi Haflidason and Berit Oline Blihovde Hjelstuen (UB) for contributing bathymetric data and Brian Robins for language editing.
References
Andresen
A.,
Bergh
S.G.
&
Haremo
P. 1992. Basin inversion and thin-skinned deformation associated with the Tertiary transpressional west Spitsbergen Orogen. Proceedings of International Conference on Arctic Margins, OCS Study MMS 94-0040, 161–166.
Bergh
S.G.,
Braathen
A.
&
Andresen
A. 1997.
Interaction of basement-involved and thin-skinned tectonism in the Tertiary fold-thrust belt of central Spitsbergen, Svalbard. AAPG Bulletin 81,
637–661.
Bergh
S.G.,
Maher
H.D.
Jr.
&
Braathen
A. 2000.
Tertiary divergent thrust directions from partitioned transpression, Brøggerhalvøya, Spitsbergen. Norsk Geologisk Tidsskrift 80,
63–82.
[Crossref]
Bergh
S.G.,
Maher
H.D.
Jr.
&
Braathen
A. 2011.
Late Devonian transpressional tectonics in Spitsbergen, Svalbard, and implications for basement uplift of the Sørkapp–Hornsund High. Journal of the Geological Society, London 168,
441–456.
[Crossref]
Bergh
S.G.,
Ohta
Y.,
Andresen
A.,
Maher
H.D.,
Braathen
A.
&
Dallmann
W.K.
2003. Geological map of Svalbard, 1:100,000, sheet B8G St. Jonsfjorden. Norsk Polarinstitutt Temakart 34. Tromsø: Norwegian Polar Institute.
Birkenmajer
K.
1972.
Alpine fold belt of Spitsbergen.
In J.E. Gill (ed.): International geological congress, twenty-fourth session. Section 3. Tectonics. Pp. 282–292. Ottawa: International Geological Congress.
Birkenmajer
K. 1975.
Caledonides of Svalbard and plate tectonics. Bulletin of the Geological Society of Denmark 24,
1–19.
Birkenmajer
K.
1981.
The geology of Svalbard, the western part of the Barents Sea, and the continental margin of Scandinavia.
In A.E.M. Nairn et al. (eds.): The ocean basins and margins. Vol. 5. The Arctic Ocean. Pp. 265–329. New York: Plenum Press.
Braathen
A.
&
Bergh
S.G. 1995.
Kinematics of Tertiary deformation in the basement-involved fold–thrust complex, western Nordenskiöld-Land, Svalbard—tectonic implications based on fault–slip data-analysis. Tectonophysics 249,
1–29.
[Crossref]
Braathen
A.,
Bergh
S.G.
&
Maher
H.D. 1995.
Structural outline of a Tertiary basement-cored uplift inversion structure in western Spitsbergen, Svalbard—kinematics and controlling factors. Tectonics 14,
95–119.
[Crossref]
Braathen
A.,
Bergh
S.G.
&
Maher
H.D.
Jr. 1999.
Application of a critical wedge taper model to the Tertiary transpressional fold–thrust belt on Spitsbergen. Geological Society of America Bulletin 111,
1468–1485.
CASE Team (Cepek
P.,
Gosen
W.,
Lyberis
N.,
Manby
G.,
Paech
H.J.,
Piepjohn
K.,
Tessensohn
F.
&
Thiedig
F.) 2001. The evolution of the west Spitsbergen fold-and-thrust belt. In
F.
Tessensohn (ed.): Intra-continental fold belts. Case 1. West Spitsbergen. Geologisches Jahrbuch B 91. Pp. 733–773.
Stuttgart: Schweizerbart.
Dallmann
W.K. (ed.) 1999. Lithostratigraphic lexicon of Svalbard.
Tromsø: Norwegian Polar Institute.
Dallmann
W.K.
2007.
Geology of Svalbard.
In E. Sigmond & D. Roberts (eds.): Geology of the land and sea areas of northern Europe. Norges Geologiske Undersøkelse Special Publication 10. Pp. 87–89. Trondheim: Geological Survey of Norway.
Dallmann
W.K.,
Andresen
A.,
Bergh
S.G.,
Maher
H.D.
&
Ohta
Y.
1993. Tertiary fold-and-thrust belt of Spitsbergen, Svalbard: compilation map, summary and bibliography. Norsk Polarinstitutt Meddelelser 128. Oslo: Norwegian Polar Institute.
Dallmann
W.K.,
Piepjohn
K.,
Blomeier
D.
&
Elvevold
S.
2009. Geological map Svalbard 1:100,000, sheet C8G, Billefjorden. Revised edn. Norsk Polarinstitutt Temakart 43. Tromsø: Norwegian Polar Institute.
Elverhøi
A.,
Lønne
Ø.
&
Seland
R. 1983.
Glaciomarine sedimentation in a modern fjord environment, Spitsbergen. Polar Research 1,
127–149.
[Crossref]
Engen
Ø.,
Faleide
J.I.
&
Dyreng
T.K. 2008.
Opening of the Fram Strait gateway—a review of plate tectonic constraints. Tectonophysics 450,
51–69.
[Crossref]
Faleide
J.I.,
Gudlaugsson
S.T.,
Eiken
O.
&
Hanken
N.M. 1988.
Seismic structure of Spitsbergen: implications for Tertiary deformation. Norsk Polarinstitutts Rapportserie 46,
46–50.
Faleide
J.I.,
Solheim
A.,
Fiedler
A.,
Hjelstuen
B.O.,
Andersen
E.S.
&
Vanneste
K. 1996.
Late Cenozoic evolution of the western Barents Sea–Svalbard continental margin. Global and Planetary Changel 12,
53–74.
[Crossref]
Faleide
J.I.,
Tsikalas
F.,
Breivik
A.J.,
Mjelde
R.,
Ritzmann
O.,
Engen
Ø.,
Wilson
J.
&
Eldholm
O. 2008.
Structure and evolution of the continental margin off Norway and the Barents Sea. Episodes 31,
82–91.
Faleide
J.I.,
Vagnes
E.
&
Gudlaugsson
S.T. 1993.
Late Mesozoic–Cenozoic evolution of the south-western Barents Sea in a regional rift–shear tectonic setting. Marine and Petroleum Geology 10,
186–214.
[Crossref]
Fossen
H.,
Dallman
W.
&
Andresen
A.
2008.
The mountain chain rebounds and founders. The Caledonides are worn down: 405–359 million years.
In I.B. Ramberg et al. (eds.): The making of a land. Geology of Norway. Pp. 232–259. Trondheim: Geological Society of Norway.
Friend
P.F.
&
Moody-Stuart
G.M.
1972. Sedimentation of the Wood Bay Formation (Devonian) of Spitsbergen: regional analysis of a late orogenic basin. Norsk Polarinstitutt Skrifter 157. Oslo: Norwegian Polar Institute.
Gaina
C.,
Gernigon
L.
&
Ball
P. 2009.
Palaeocene–recent plate boundaries in the NE Atlantic and the formation of the Jan Mayen microcontinent. Journal of the Geological Society 166,
601–616.
[Crossref]
Gee
D.G.,
Fossen
H.,
Henriksen
N.
&
Higgins
A.K. 2008.
From the early Paleozoic platforms of Baltica and Laurentia to the Caledonide orogen of Scandinavia and Greenland. Episodes 31,
44–51.
Germond
F.
2005. Sedimentary and acoustic analysis of Isfjorden area (Svalbard) N-Norway. Cherbourg: National Institute for Marine Sciences and Techniques.
Harland
W.B. 1959.
The Caledonian sequence in Ny Friesland, Spitsbergen. The Quarterly Journal of the Geological Society of London 114,
307–342.
[Crossref]
Harland
W.B.
1969.
Contribution to the evolution of the North Atlantic region.
In M. Kay (ed.): North Atlantic: geology and continental drift, a symposium; papers. Pp. 817–857. Tulsa: American Association of Petroleum Geologists.
Harland
W.B.
1985.
Caledonide Svalbard.
In D.G. Gee & B.A. Sturt (eds.): The Caledonide orogen: Scandinavia and related areas. Pp. 999–1016. New York: John Wiley & Sons.
Hjelle
A.
1993. Geology of Svalbard. Polarhåndbok 7. Oslo: Norwegian Polar Institute.
Lauritzen
Ø.,
Salvigsen
O.
&
Winsnes
T.S.
1989. Geological map of Svalbard, 1:100,000, sheet C8G, Billefjorden. Norsk Polarinstitutt Temakart 5. Oslo: Norwegian Polar Institute.
Leever
K.A.,
Gabrielsen
R.H.,
Faleide
J.I.
&
Braathen
A.
2011. A transpressional origin for the West Spitsbergen fold-and-thrust belt: insight from analog modeling. Tectonics
30, TC2014, doi: 10.1029/2010TC002753.
[Crossref]
Leever
K.A.,
Gabrielsen
R.H.,
Sokoutis
D.
&
Willingshofer
E.
2011. The effect of convergence angle on the kinematic evolution of strain partitioning in transpressional brittle wedges: insight from analogue modeling and high resolution digital image analysis. Tectonics
30, TC2013, doi: 10.1029/2009TC002649.
[Crossref]
Lowell
J.D.
1972. Spitsbergen Tertiary orogenic belt and the Spitsbergen Fracture Zone. Geological Society of America Bulletin
83, 3091–3102.
Lundin
E.
&
Dore
A.G. 2002.
Mid-Cenozoic post-breakup deformation in ‘passive’ margins bordering the Norwegian–Greenland Sea. Marine and Petroleum Geology 19,
79–93.
[Crossref]
Lyberis
N.
&
Manby
G.M. 1993a.
The West Spitsbergen Fold Belt: the result of Late Cretaceous–Palaeocene Greenland–Svalbard convergence? Geological Journal 28,
125–136.
[Crossref]
Lyberis
N.
&
Manby
G.M. 1993b.
The origin of the West Spitsbergen Fold Belt from geological constraints and plate kinematics: implications for the Arctic. Tectonophysics 224,
371–391.
[Crossref]
Maher
H.D.
&
Craddock
C. 1988.
Decoupling as an alternate model for transpression during the initial opening of the Norwegian Greenland Sea. Polar Research 6,
137–140.
[Crossref]
Maher
H.D.
Jr.,
Ringset
N.
&
Dallmann
W. 1989.
Tertiary structures in the platform cover strata of Nordenskiold Land, Svalbard. Polar Research 7,
83–93.
[Crossref]
Major
H.,
Haremo
P.,
Dallmann
W.K.
&
Andresen
A.
2000. Geological map of Svalbard, 1:100 000, sheet C9G, Adventdalen. Norsk Polarinstitutt Temakart 31. Tromsø: Norwegian Polar Insitute.
Major
H.
&
Nagy
J.
1972. Geology of the Adventdalen map area. Norsk Polarinstitutt Skrifter 138. Oslo: Norwegian Polar Institute.
Mjelde
R.
2004. Cruise report: SVALEX 2004: MCS survey, central Isfjorden by use of G.O. Sars, 26 August–3 September, 2004. Bergen: Department of Earth Science, University of Bergen.
Mjelde
R.
2008. Cruise report: SVALEX 2008: MCS survey, shelf area Isfjorden/Van Mijenfjorden and inner Isfjorden, 24 August–1 September, 2008. Bergen: Department of Earth Science, University of Bergen.
Mosar
J.,
Torsvik
T.H.
& the BAT Team 2002. Opening of the Norwegian and Greenland seas: plate tectonics in mid Norway since the Late Permian. In
E.A.
Eide (ed.): BATLAS—mid Norway plate reconstructions atlas with global and Atlantic perspectives. Pp. 48–59.
Trondheim: Geological Survey of Norway.
Murashov
L.G.
&
Mokin
J.I. 1979.
Stratigraphic subdivision of the Devonian deposits of Spitsbergen. Norsk Polarinstitutt Skrifter 167,
249–261.
Nøttvedt
A.
1994.
Post Caledonian sediments on Spitsbergen.
In O. Eiken (ed.): Seismic atlas of western Svalbard. Norsk Polarinstitutt Meddelelser 130. Pp. 40–48. Oslo: Norway.
Ohta
Y.
1992.
Recent understanding of the Svalbard basement in the light of new radiometric age determinations.
In W.K. Dallmann et al. (eds.): Post-Caledonian tectonic evolution of Svalbard. Norsk Geologisk Tidsskrift 72. Pp. 1–5.
Ohta
Y.,
Hjelle
A.,
Andresen
A.,
Dallmann
W.K.
&
Salvigsen
O.
1992. Geological map of Svalbard, 1:100,000, sheet B9G, Isfjorden. Norsk Polarinstitutt Temakart 16. Oslo: Norwegian Polar Institute.
Olesen
O.,
Ebbing
J.,
Lundin
E.,
Mauring
E.,
Skilbrei
J.R.,
Torsvik
T.H.,
Hansen
E.K.,
Henningsen
T.,
Midbøe
P.
&
Sand
M. 2007.
An improved tectonic model for the Eocene opening of the Norwegian–Greenland Sea: use of modern magnetic data. Marine and Petroleum Geology 24,
53–66.
[Crossref]
Piepjohn
K.
&
von Gosen
W.
2001.
The southern margin of the belt of emergent thrusting on the north coast of Isfjorden.
In F. Tessensohn (ed.): Intra-continental fold belts. Case 1. West Spitsbergen. Geologisches Jahrbuch B 91. Pp. 129–156. Stuttgart: Schweizerbart.
Saalmann
K.
&
Thiedig
F. 2002.
Thrust tectonics on Brøggerhalvøya and their relationship to the Tertiary west Spitsbergen fold-and-thrust belt. Geological Magazine 139,
47–72.
[Crossref]
Srivastava
S.P. 1978.
Evolution of the Labrador Sea and its bearing on the early evolution of the North Atlantic. Geophysical Journal of the Royal Astronomical Society 52,
313–357.
[Crossref]
Srivastava
S.P. 1985.
Evolution of the Eurasian Basin and its implications to the motion of Greenland along Nares Strait. Tectonophysics 114,
29–53.
[Crossref]
Steel
R.J.,
Gjelberg
J.,
Helland-Hansen
W.,
Kleinspehn
K.,
Nøttvedt
A.
&
Rye Larsen
M.
1985.
The Tertiary strike–slip basins and orogenic belt of Spitsbergen.
In K.T. Biddle & N. Christie-Blick (eds.): Strike–slip deformation, basin formation, and sedimentation, based on a symposium by the Society of Economic Paleontologists and Mineralogists. Pp. 339–360. Tulsa: Society of Economic Paleontologists and Mineralogists.
Talwani
M.
&
Eldholm
O. 1977.
Evolution of the Norwegian–Greenland Sea. Geological Society of America Bulletin 88,
969–999.
Tessensohn
F.
&
Piepjohn
K. 2000.
Eocene compressive deformation in Arctic Canada, North Greenland and Svalbard and its plate tectonic causes. Polarforschung 68,
121–124.
Tessensohn
F.
2001.
Objectives of investigation.
In F. Tessensohn (ed.): Intra-continental fold belts. Case 1. West Spitsbergen. Geologisches Jahrbuch B 91. Pp. 11–20. Stuttgart: Schweizerbart.
Vogt
T. 1928.
Den norske fjellkjedes revolusjons-historie. (Revolutionary history of the Norwegian mountain range.) Norsk Geologisk Tidsskrift 10,
97–115.
Vogt
T. 1929.
Frå en Spitsbergen-ekspedition i 1928. (From an expedition to Spitsbergen in 1928.) Det Norske Videnskaps-Akademi Årbok 11,
10–12.
Von Gosen
W.,
Paech
H.-J.
&
Piepjohn
K.
2001.
Involvement of basal tertiary strata in the fold-belt deformation in Nordenskiöld Land.
In F. Tessensohn (ed.): Intra-continental fold belts. Case 1. West Spitsbergen. Geologisches Jahrbuch B 91. Pp. 229–242. Stuttgart: Schweizerbart.
Worsley
D.
&
Aga
O.J.
1986. The geological history of Svalbard: evolution of an Arctic archipelago. Stavanger: Statoil.
Worsley
D. 2008.
The post-Caledonian development of Svalbard and the western Barents Sea. Polar Research 27,
298–317.
[Crossref]