RESEARCH/REVIEW ARTICLE
Summer foraging behaviour of shallow-diving seabirds and distribution of their prey, Arctic cod (Boreogadus saida), in the Canadian Arctic
Jordan K. Matley,1 Richard E. Crawford2 & Terry A. Dick1
1 Department of Biological Sciences, University of Manitoba, Winnipeg, Manitoba R3T 2N2, Canada
2 102 Camilla Road, Washington, NC 27889, USA
Abstract
Productive areas in the Canadian Arctic seasonally provide top predators with accessible and often predictable sources of energy. Arctic cod (Boreogadus saida) aggregate in shallow bays during the summer and are exploited by seabirds and marine mammals. Information concerning how prey is presented to predatory seabirds, and the cues seabirds use to optimize foraging potential, is limited. Hydroacoustic surveys were completed in Allen Bay, Nunavut, to determine the presence, density, abundance, and depth of Arctic cod schools in relation to shallow-diving seabirds. Schools were also documented using standardized protocols to examine the influence of environmental variables, such as wind, ice, tidal states and seabird behaviour. The presence of schools was a significant predictor of the distribution of northern fulmars (Fulmarus glacialis) but not black-legged kittiwakes (Rissa tridactyla). Glaucous gulls (Larus hyperboreus) associated with northern fulmars are likely optimizing chances of stealing Arctic cod. The density, size and depth of schools did not significantly affect the distribution of the seabirds. We speculate that Arctic cod from demersal schools separate to feed at the surface in satellite schools (groups of dispersed fish), thus reducing competition but increasing the risk of predation.
Keywords
Satellite schools; schooling; predators; northern fulmar; black-legged kittiwake; glaucous gull.
Correspondence
Terry A. Dick, Department of Biological Sciences, University of Manitoba, Winnipeg, Manitoba R3T 2N2, Canada.
E-mail: terrydick09@gmail.com
(Published: 3 September 2012)
Polar Research 2012. © 2012 J.K. Matley et al. This is an open-access article distributed under the terms of the Creative Commons Attribution-Noncommercial 3.0 Unported License (http://creativecommons.org/licenses/by-nc/3.0/), permitting all non-commercial use, distribution, and reproduction in any medium, provided the original work is properly cited.
Citation: Polar Research 2012, 31, 15894, http://dx.doi.org/10.3402/polar.v31i0.15894
High-density aggregations of prey provide efficient transfer of energy through marine food webs by maximizing predator–prey encounter rates and minimizing predator search efforts (Davoren et al. 2003a). The recurrence of these aggregations in predictable locations enables foraging species to utilize productive areas repeatedly, i.e., seasonally (Irons 1998). These locations are found by memory or by reacting to cues of other animals (Davoren et al. 2003b), and act as vital resources in an environment where high-energy prey is often difficult to locate (Irons 1998). How seabirds distribute and locate prey is critical to understand the importance of aggregations and their influence on predator–prey interactions. This is especially significant given the concerns of anthropogenic impacts affecting the Arctic ecosystem. In addition to predator behaviour, determining the conditions that influence the behaviour of prey is important to understand how seabirds associate with prey (Piatt et al. 1989).
Arctic cod (Boreogadus saida) is a small circumpolar fish that is an important link between lower and higher trophic levels (Welch et al. 1992). It is the major diet item of top predators in the Arctic and provides more than 2000 times the energy of a single calanoid copepod (Bradstreet & Cross 1982). During the summer, Arctic cod aggregate in shallow bays where they are exposed to seabird predation (Welch et al. 1993). The recurrence of Arctic cod in Allen Bay on the southern coast of Cornwallis Island, Nunavut, is an annual source of energy for seabirds. The number of fish per school varies but is estimated to exceed 900 million individuals (Crawford & Jorgensen 1996). Arctic cod are also distributed as scattered or dispersed individuals at low densities (Crawford & Jorgenson 1993). The movements of Arctic cod are influenced by ocean conditions such as temperature and salinity, feeding behaviour and predator avoidance (Benoit et al. 2008; Geoffroy et al. 2011; Crawford et al. 2012).
To date, most studies describe the feeding of deep-diving seabirds (e.g., murres) and deep schools (>25 m) (e.g., Mehlum et al. 1996; Logerwell et al. 1998; Davoren et al. 2003a). By contrast, not much is known about foraging cues for shallow-diving seabirds. Moreover, as seabirds exhibit different foraging patterns in response to prey (Elliott et al. 2008), the extent of association is likely species specific. Surface-feeding seabirds such as northern fulmars (Fulmarus glacialis) and black-legged kittiwakes (Rissa tridactyla) are important components of the Arctic ecosystem, estimated to consume about 11 000 tonnes of Arctic cod annually in the Lancaster Sound region (Welch et al. 1992). According to Hobson & Welch (1992) and Garthe & Furness (2001), northern fulmars only pose a threat to fishes distributed within the upper 3 m of water. Our observations of diving behaviour support this, and we estimate black-legged kittiwakes are restricted to the top 1 m. Compared to deep-diving birds such as the thick-billed murre (Uria lomvia), northern fulmars and black-legged kittiwakes consume more Arctic cod per individual in the Canadian Arctic (see Table 8 in Welch et al. 1992; see Table 3 in Mallory & Fontaine 2004).
Standardized observations and hydroacoustic surveys were used to examine the behaviour of shallow-diving seabirds and Arctic cod in a nearshore habitat to identify cues predators use to locate prey. Preliminary observations revealed that northern fulmars primarily fed on schooling Arctic cod whereas black-legged kittiwakes captured dispersed and schooling Arctic cod equally. Based on these observations, we hypothesized that the presence of schools significantly influenced the distribution of northern fulmars but not black-legged kittiwakes. We predicted that the density of northern fulmars would be highly correlated with schools but the density of black-legged kittiwakes would not. Since schools represent large pools of energy for seabirds, our second hypothesis was that the nature of the schools (areal density, number of individuals, and the minimum depth of schools) are key factors attracting northern fulmars and black-legged kittiwakes to schools, and there will be a density-dependent relationship. By contrast, glaucous gulls (Larus hyperboreus) acquire food indirectly by stealing Arctic cod from other birds, particularly northern fulmars (Matley et al. 2012). Consequently, our third hypothesis was that the association of glaucous gulls with northern fulmars is more important than the presence or nature of the schools. We predicted that glaucous gulls associate with northern fulmars whether or not schools are present, and this association is unrelated to school size, fish density, and depth. Specifically, the objectives of this study were to: (1) determine the extent to which seabirds distribute in relation to Arctic cod and their potential as indicators of fish distribution; (2) examine cues that predators react to in order to maximize foraging potential; and (3) describe the importance of schooling for predators.
Materials and methods
Study area
Allen Bay is located in the Canadian Arctic Archipelago (74°43'36.78"N 95°09'25.23"W; Fig. 1). It is a small (ca. 200 km2), shallow (rarely >30 m deep) bay located near the community of Resolute on Cornwallis Island. The bay opens on the productive Resolute Passage and the Lancaster Sound region (Cota et al. 1987; Welch et al. 1992). The timing of ice break-up varies interannually and in 2010, it occurred in early August, although drift ice was continually present throughout the summer. Once ice moves out of the bay, seabirds return to the area annually to feed on schools of Arctic cod. This study focused on the south-eastern part of the bay, an area of approximately 10 km2 (Fig. 1) after an initial survey revealed fish and predation activity were less common in the north. Preliminary observations of seabird and cod behaviour began in early July 2010.
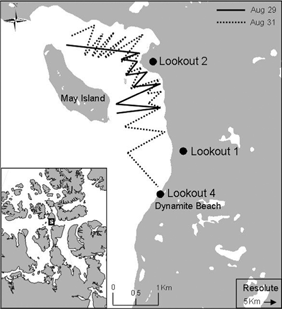
Fig. 1
The study area in Allen Bay, Cornwallis Island, Nunavut, with an inset showing the Canadian Arctic Archipelago. The zigzagging lines illustrate the hydroacoustic transects undertaken on 29 and 31 August 2010. Circles show the locations of shore-based observations.
Shore-based survey
The shore-based survey studied the influence of environmental variables as predictors of the presence of schools from 13 to 31 August 2010. Individual foraging seabirds were randomly observed for 5 minutes from three elevated locations on shore. Sample periods were divided into 6-h categories (0:01–6:00, 6:01–12:00, 12:01–18:00, and 18:01–24:00) during 24 hours of daylight. Observation periods at each location were about 4 hours in each time category, for a total of 16 hours per location (Fig. 1). Environmental variables and presence (or absence) of Arctic cod schools were recorded. Environmental variables included wind speed (km h-1), wind direction (deviation from south), tidal state (ebb or flood tide), air temperature (°C), Beaufort state (a measure of wave action on a scale from 0 to 5) and the presence of ice (estimated percent cover in the study area and the bay).
Elevated lookout sites on land enabled visual detection and characterization of schools close to the surface. A number of cues were used to detect schools, including dark areas in the water, turbulence caused by surface-breaching fishes and foraging activity of predators such as seabirds, seals and whales. Location, size and shape of schools were recorded. Estimates of school size were based on surface area and then standardized using a qualitative scaling grade of 0–5 (0≤30 m2<1≤200 m2<2≤1000 m2<3≤6000 m2<4≤10°000 m2<5). If >100 birds were seen feeding on a single school or in a concentrated area, the species and number of birds, size and location of the school, and associated behaviours of predator and prey were recorded.
Hydroacoustic survey
Fish density and distribution were examined on 29 and 31 August 2010 with a BioSonics (Seattle, WA, USA) DTX hydroacoustic system (200 KHz; split beam; 6° nominal half-power beam angle; 1 m blanking range) operated from a 6.6 m skiff, equipped with a global positioning system (GPS) device, travelling at an average of 6.7 km h-1. The transducer was mounted on a staff attached to the boat and fixed at the shallowest depth (0.75 m) to avoid turbulence from the boat and waves. The system was calibrated with a tungsten–copper standard target (Foote et al. 1987) prior to the survey. Sampling (6 pings s-1) commenced upon leaving the launch site and was conducted in an “adaptive” zigzag survey pattern (Fig. 1) to avoid drifting and grounded ice pans. When the northern extent of fish distribution was reached, the remainder of the survey covered the region southward to a shallow flat near Dynamite Beach (Fig. 1), where ice floes lodged in the shallow water restricted boat operations.
Individual target data (echo minimum threshold - 65 dB) was extracted from the overall data set and analysed separately (1 m depth bins). Minimum and maximum depths of each target, as well as ping numbers, local time and position (latitude and longitude) for leading and trailing edges were recorded. All targets were analysed with target strength (TS) analysis (Visual Analyzer, BioSonics) to measure backscatter cross-section and possibly derive acoustic estimates of fish size. Data from schools and groups of scattered fish (satellite schools) were analysed with echo integration (EI) to derive estimates of area density (fish per m-2) and volume density (fish per m-3). Additional details of methods are described in Crawford & Jorgenson (1996) with one exception: EI was scaled directly from in situ determinations of target backscattering cross-section (obtained from TS analysis) rather than the secondarily derived scaling factor used in Crawford & Jorgenson (1996). However, many targets (especially dense aggregations) had depth bins without TS estimates because TS analysis requires the detection of individual fish, i.e., fish cannot be closely spaced. To minimize interpolation (i.e., using a derived scaling factor where TS was missing), only schools that had zero or one “empty” depth bins were selected for EI analysis (i.e., they were “highest” quality).
Horizontal interpolation in estimates of area density was avoided so that accuracy could be optimized. Transects often crossed the same school, especially the long narrow “strings” of fish moving near shore. Data from adjacent transects are usually pooled and school area and total abundance are derived from this interpolation in order to estimate school size (see Crawford & Jorgenson 1996). Seabirds in this study were foraging at the surface and had a limited view of the school beneath them. Consequently, we did not interpolate across transects but used measurements from each transect, that is, the region directly beneath that which the birds had occupied, before being displaced by the approaching survey boat. This meristic, called transect abundance (TA), was obtained by multiplying area density times the length of the section of a school traversed during a transect (obtained from converting GPS coordinates marking the leading and trailing edges of the section). Arctic cod was the only fish species seen captured by seabirds, and over 40 days of gillnetting and seining in Allen Bay confirmed that cod was the only common pelagic fish species, which is consistent with other studies in the same area (e.g., Crawford & Jorgenson 1993). Trap netting recovered Arctic cod and two benthic sculpin species.
Concurrent with hydroacoustic sampling the observer searched in a 90° arc from bow to side beam using the strip-transect method to enumerate seabirds and identify species. The strip width was 150 m: birds were counted within 75 m from the port and starboard side of the observer. Birds flying and resting on water and ice were counted instantaneously following the method described by Tasker et al. (1984) in sections about 250 m in length; these data were compared with Arctic cod distribution on a fine scale. Individual birds were counted only once.
Data analysis
The Akaike information criterion with a small-sample bias adjustment (AICc; Akaike 1974; Burnham & Anderson 2002) was used to select the linear models that best associated environmental variables with the presence of Arctic cod schools during the shore-based survey. Linear regression was used to examine the relationship between size of schools and number of birds for large feeding events (>100 birds) observed from shore. Because of the low sample size, data from both days were pooled for the hydroacoustic component. Logistic regression was used to determine if seabird density (independent variable) was associated with the presence of schools (dependent variable). Each section (150 m×250 m) was designated as a sample. The relationship between the number of birds and density of schools was examined by categorizing bird density in each section as being above or below the average density of each species during the survey. Logistic regression was then used to compare the areal density (fish per unit area) of schools (independent variable) with the presence of above- and below-average bird densities (dependent variable). Since the sample size was low (n<100), each data set was also analysed using a Kolmogorov–Smirnov (K–S) test, but no difference was found. The P values presented for these analyses represent the logistic regression tests. The minimum depth and TA were similarly compared to bird densities.
Spearman rank correlation (using densities) and Phi coefficient of association (using presence or absence) were used to explore the distributional associations between seabird species and schooling, and non-schooling Arctic cod. Fisher's exact probability test (two-tailed) was used to determine significance of Phi coefficient. Jaccard's coefficient of similarity was also used but is not presented here as trends were the same as Phi coefficients. Seabirds resting on ice were not included in the analyses. Alpha was set to 0.05 for all analyses.
Results
Shore-based survey
Based on the optimal linear models applied to environmental variables, the presence of schools was best predicted by the presence of ice (positive association) and air temperature (negative association; Table 1).
Table 1 The Akaike information criterion with small-sample bias adjustment (AICc) optimal linear model selection for environmental variables influencing the presence of schools of Arctic cod (Boreogadus saida) during shore-based observations (N=15). The best eight models are presented based on the smallest AICc differences. Statistically significant variables are indicated with asterisks.
| Number of variables in model |
R2
|
AICc
|
Error sum of squares |
Variables in model |
P
|
| 2 |
0.532 |
-35.507 |
0.882 |
Air temperature |
0.004* |
|
|
|
|
Presence of icea
|
0.081 |
| 2 |
0.514 |
-34.941 |
0.916 |
Air temperature |
0.004* |
|
|
|
|
Presence of iceb
|
0.106 |
| 1 |
0.391 |
-34.237 |
1.148 |
Air temperature |
0.013* |
| 3 |
0.568 |
-33.529 |
0.814 |
Air temperature |
0.003* |
|
|
|
|
Presence of icea
|
0.265 |
|
|
|
|
Presence of iceb
|
0.358 |
| 4 |
0.664 |
-33.473 |
0.633 |
Air temperature |
0.002* |
|
|
|
|
Presence of icea
|
0.034* |
|
|
|
|
Beaufort statec
|
0.119 |
|
|
|
|
Wind speed |
0.076 |
| 3 |
0.566 |
-33.462 |
0.817 |
Air temperature |
0.004* |
|
|
|
|
Presence of icea
|
0.075 |
|
|
|
|
Wind speed |
0.372 |
| 3 |
0.556 |
-33.122 |
0.836 |
Air temperature |
0.007* |
|
|
|
|
Presence of icea
|
0.086 |
|
|
|
|
Time of day |
0.455 |
| 3 |
0.556 |
-33.100 |
0.837 |
Air temperature |
0.004* |
|
|
|
|
Presence of icea
|
0.095 |
|
|
|
|
Visibility |
0.461 |
| aIndicates the estimated presence of ice in the study area. |
| bIndicates the estimated presence of ice in Allen Bay. |
| cBeaufort state is a measure of wave action. |
The first school of Arctic cod was observed 1 August 2010 and many were observed throughout the study period. The size, shape and location of schools varied across the study area (Figs. 2, 3). Arctic cod often swam near the surface and close to shore in waters<10 m deep. Moving schools were typically long and narrow while schools aggregating in a particular area were more compact (Figs. 2, 3). On several occasions the three species of seabirds followed a school when visible even if individual fish were too deep to capture.
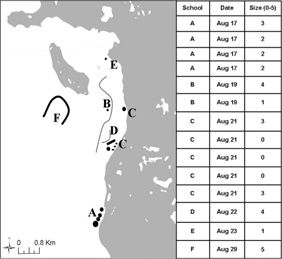
Fig. 2
Representation of visible schools (A–F) observed from elevated positions during shore-based observations. Inset: Letters correspond to a school which is shown in its approximate size and shape. Size was estimated based on surface area and standardized using a qualitative scaling grade of 0–5 (0≤30 m2<1≤200 m2<2≤1000 m2<3≤6000 m2<4≤10 000 m2<5).
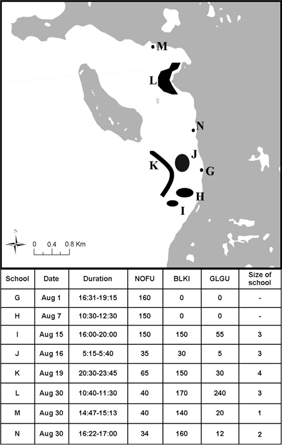
Fig. 3
Location and shape and size and duration (inset) of schools (G–N) and number of birds observed during large feeding events (>100 birds). Note schools G and H consisted of larval Arctic cod (Boreogadus saida) and size was not estimated. Schools G and H were observed from our boat before surveys commenced. The size of schools was not correlated with the number of birds. Species names are abbreviated as follows: glaucous gull (Larus hyperboreus) is GLGU, northern fulmar (Fulmarus glacialis) is NOFU and black-legged kittiwake (Rissa tridactyla) is BLKI.
Eight feeding events resulted in a large number of cod being captured, two of which were larval Arctic cod (Fig. 3). School size was not correlated with seabird abundance (df=5, r2=0.071, P=0.609). On three occasions (schools L, M, and N; Fig. 3) schools aggregated near shore in water<2 m where in one instance at least 164 Arctic cod were taken by <200 birds in only 10 minutes. These Arctic cod did not attempt to escape into deeper water but it was not clear why, because there was no obvious predator pressure from below, e.g., from seals or whales (Welch et al. 1993). These feeding events were brief (<1 h) and resulted in the mortality of most individuals in a school. Other larger feeding events lasted longer (schools I and K; Fig. 3). For example, on 15 August a group of nine belugas (Delphinapterus leucas) fed on a school close to shore and, as a result, one of the largest concentrations of foraging birds during the entire study period was observed (Fig. 3). When the belugas moved on, approximately half the birds followed, while the rest remained in the area for at least 4 h, occasionally capturing dispersed Arctic cod, presumably from the original school.
Hydroacoustic survey
Thirty-six transects (25.4 km) were completed on 29 and 31 August and revealed that school distribution and shape was highly variable. On average, schools remained at depths>5 m with vertical ranges between 6.2 and 18.4 m (Table 2). Maximum volume density ranged up to 614 fish m-3, and the mean volume density was 9.6 and 25.4 fish m-3 on 29 and 31 August, respectively (Table 2). Often small satellite schools were detected close to the surface near larger demersal schools (Fig. 4). This was corroborated by numerous independent observations on the water as well as observations of seabirds commonly feeding on loosely aggregated individuals at the surface.
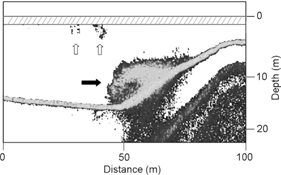
Fig. 4
Demersal school (black arrow) and nearby shallow “satellite” schools (white arrows). The dashed area represents the blanking range of about 1.75 m. Note this echogram was recorded independent of bird survey on 29 August 2010.
Table 2 Summary of results of hydroacoustic surveying during 29 and 31 August 2010. Fish per unit area (areal density) is abbreviated to FPUA, fish per unit area (volume density) to FPCM and target strength to TS (decibels).
| |
|
Targets (n) |
FPUA (fish m-2) |
FPCM max (fish m-3) |
FPCM average (fish m-3) |
Average TS (dB) |
Target depth upper limit (m) |
Target depth deepest limit (m) |
| 29 Aug 2010 |
Average |
118.1 |
82.0 |
61.9 |
9.6 |
-52.83 |
7.2 |
13.1 |
|
Max |
497 |
718 |
614 |
92.4 |
-48.64 |
11.1 |
17.0 |
|
Min |
7 |
0.1 |
0.0 |
0.0 |
-55.33 |
1.8 |
3.6 |
|
SD |
144.8 |
169.1 |
145.4 |
23.0 |
2.23 |
2.6 |
3.4 |
| 31 Aug 2010 |
Average |
197.0 |
209.8 |
93.0 |
25.4 |
-53.54 |
6.2 |
18.4 |
|
Max |
800 |
521.3 |
223.6 |
73.3 |
-49.64 |
8.2 |
24.8 |
|
Min |
9 |
1.4 |
1.0 |
0.2 |
-55.33 |
2.9 |
12.0 |
|
SD |
223.0 |
166.6 |
71.5 |
21.7 |
1.90 |
1.5 |
4.1 |
On 31 August the northern section of the study area contained several schools and high densities of seabirds compared to the southern section (Fig. 5). Northern fulmars (P=0.007) and glaucous gulls (P=0.036) were significantly associated with the presence of Arctic cod schools but black-legged kittiwakes were not (P=0.574; Fig. 6). Above-average number of all species were present when schools were denser, more numerous and closer to the surface but the correlations were not significant (Fig. 7). Glaucous gulls were significantly associated with northern fulmars regardless if schools were present or absent (Table 3).
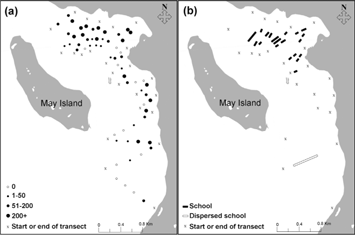
Fig. 5
(a) The density (birds km-2) of black-legged kittiwakes (Rissa tridactyla), northern fulmars (Fulmarus glacialis) and glaucous gulls (Larus hyperboreus) during the survey on 31 August 2010. (b) Schools detected in Allen Bay during the same survey. Solid bars represent length of school.
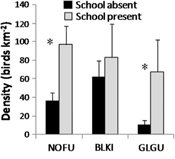
Fig. 6
Density of seabirds counted in each 250 m long section (N=87) on 29 August 2010 and 31 August 2010 partitioned when schools were present and absent. Species names are abbreviated as follows: glaucous gull (Larus hyperboreus) is GLGU, northern fulmar (Fulmarus glacialis) is NOFU and black-legged kittiwake (Rissa tridactyla) is BLKI. Significant differences (P<0.05) are indicated with asterisks.
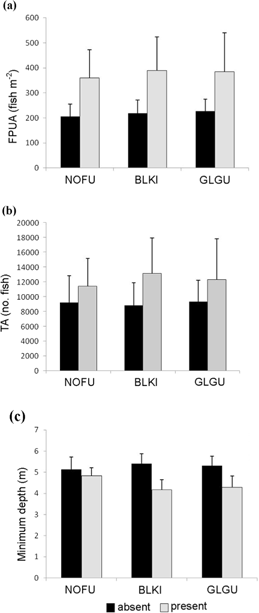
Fig. 7
(a) Arctic cod per unit area (FPUA; fish m-2), (b) transect abundance (TA) and (c) minimum depth of Arctic cod (Boreogadus saida) schools (N=35) when below-average (absent) and above-average (present) densities of each seabird species occurred. Average densities were as follows: glaucous gull (GLGU; Larus hyperboreus) 34.08 birds km-2; northern fulmar (NOFU; Fulmarus glacialis) 61.61 birds km-2; and black-legged kittiwake (BLKI; Rissa tridactyla) 71.12 birds km-2. All comparisons are at the 95% confidence level.
Table 3 Association between seabird densities in each 250 m long section (N=87) surveyed on 29 and 31 August 2010 partitioned when schools were present and absent. Species names are abbreviated as follows: glaucous gull (Larus hyperboreus) is GLGU, northern fulmar (Fulmarus glacialis) is NOFU and black-legged kittiwake (Rissa tridactyla) is BLKI. R2 is Spearman rank correlation and Phi is Phi coefficient of association. Significant differences (P<0.05) are indicated with asterisks.
| |
NOFU–BLKI |
NOFU–GLGU |
BLKI–GLGU |
|
R2=0.333 |
R2=0.665 |
R2=0.313 |
|
P=0.047* |
P<0.001* |
P=0.063 |
| School present |
|
|
|
|
Phi=0.265 |
Phi=0.422 |
Phi=0.056 |
|
P=0.156 |
P=0.027* |
P=0.999 |
|
R2=0.263 |
R2=0.404 |
R2=0.268 |
|
P=0.062 |
P=0.003* |
P=0.058 |
| School absent |
|
|
|
|
Phi=0.129 |
Phi=0.326 |
Phi=0.211 |
|
P=0.407 |
P=0.037* |
P=0.221 |
Discussion
Behaviour and distribution of Arctic cod
Greater ice cover and lower air temperature were significant predictors of schools of Arctic cod in Allen Bay. Arctic cod are associated with sea ice during the spring and summer as they hide within ice cracks to avoid predators (Lønne & Gulliksen 1989; Gradinger & Bluhm 2004). Crawford & Jorgenson (1993) reported that schools occurred in denser aggregations in open water after wind pushed ice out of Resolute Bay (i.e., when ice cover diminished) and suggested this behaviour was related to predator avoidance. Arctic cod also associate with ice to feed on ice-adapted invertebrates (Bradstreet & Cross 1982; Lønne & Gulliksen 1989). The negative relationship between air temperature and the presence of schools may relate to air temperature affecting surface salinity by changing freshwater input during ice formation and melting. A positive relationship between Arctic cod abundance and salinity in Beaufort Sea coastal waters reported by Craig et al. (1982) corroborates this explanation. Arctic cod also alter their vertical distribution according to water temperature however they are usually attracted to warmer water (Crawford & Jorgenson 1996; Benoit et al. 2008; Crawford et al. 2012). An upward-looking transducer mounted on an autonomous underwater vehicle, with conductivity–temperature–density probes) could be used to evaluate the influence of ice, water temperature and salinity on Arctic cod distribution during the summer.
Schools of Arctic cod were primarily detected in the lower half of the water column which supports observations by Crawford & Jorgenson (1993, 1996). Arctic cod schools in our study were denser than those detected in Resolute Bay (Crawford & Jorgenson 1993) but less dense than larger schools in Allen Bay (Crawford & Jorgenson 1996). Echograms revealed small schools of Arctic cod near the surface in close proximity to larger demersal schools (Fig. 4). Although the volume of water sampled near the surface is less than in deeper water (Simmonds & MacLennan 2005) and vessel avoidance likely altered the composition of shallow schools (e.g., Crawford & Jorgenson 1993), observations of satellite schools were made on numerous occasions from boats that were either stationary or slow moving. Furthermore, we observed black-legged kittiwakes catching fish just beneath the surface as the birds flew by but did not dive. Swimming close to the surface in smaller schools within the range of birds reduced the potential benefit of schooling in terms of protection from predators (Pitcher 1986). The trade-off may be access to more abundant food or smaller prey items that are scarce in the vicinity of the large school. For example, Longhurst et al. (1984) reported a shallow epiplankton layer in the upper 5 m throughout the Canadian Arctic often containing higher abundances of copepods than deeper layers. In addition, schooling adults have a much higher frequency of empty stomachs than non-schooling adults (Hop et al. 1997) and zooplankton is often less abundant near schools (Crawford & Jorgenson 1996). Future research could examine the distribution of prey (e.g., zooplankton netting) in conjunction with hydroacoustics to understand their effect on Arctic cod behaviour and the functional role of satellite schools.
TS is a function of fish size (e.g., Foote et al. 1987). However, TS-based length analyses were not included due to limitations in collecting TS data close to the surface, i.e., near-field distance (Simmonds & MacLennan 2005). Based on TS–length relationship TS=21.8 log L–72.7 dB (Crawford & Jorgenson 1996), preliminary estimates of Arctic cod size from satellite schools (mean=7.57 cm on 29 August, and 8.16 cm on 31 August) were smaller than cod captured directly from schools (mean=16.05 cm, N=51). This is consistent with findings by Crawford & Jorgenson (1993) and Geoffroy et al. (2011). The TS–length relationship for Arctic cod and corresponding length-based distribution patterns warrant further research, especially in the top 3 m. Benoit et al. (2010) found that larger Arctic cod remained deeper than smaller Arctic cod in Franklin Bay (Beaufort Sea) and suggested that the greater energetic reserves (i.e., larger livers) of larger Arctic cod reduced the need to feed in shallow waters, thus minimizing seal predation. It is unclear if a similar relationship exists in nearshore areas as we observed large Arctic cod (>15 cm) captured by seabirds on numerous occasions.
Seabird foraging
Seabirds have a variety of methods to locate prey, including memory, foraging in areas used by other individuals, and reacting locally to captures—an effect known as local enhancement (Hoffman et al. 1981; Davoren et al. 2003b). It is not surprising, given these adaptations and the association with Arctic cod schools that the few large schools<3 m deep were heavily exploited. Local enhancement was one of the major behavioural cues attracting birds to Arctic cod in Allen Bay even when only one bird was feeding. This is not an uncommon occurrence (e.g., Hoffman et al. 1981) and provides insight as to why there was not a significant density-dependent relationship during the shore-based surveys. Stealing food is also an important foraging method for marine birds (Furness 1987). The presence of glaucous gulls was significantly correlated with northern fulmar presence and was likely to increase incidents of kleptoparasitism. In addition to using other birds and schools directly as foraging cues, seabirds associate with marine mammals to exploit food sources that are driven towards the surface in nearshore areas (e.g., Welch et al. 1993). These events provide seabirds with high net energetic gains considering the ease with which prey can be captured. Interestingly, on 15 August, when the whales ended feeding, ca. 50% of the seabirds followed them and the rest remained in the feeding area>4 h. The feeding intensity decreased after the whales departed, but many Arctic cod were still captured and a small group of harp seals (Pagophilus groenlandicus) were seen lingering in the area. Although large shallow schools provided high short-term benefits for the seabirds, these events were infrequent and our observations suggest smaller, less exploited schools were a more reliable food source.
The dynamics of feeding on Arctic cod by the three species of birds differed. There was a strong association between northern fulmars and glaucous gulls and between northern fulmars and Arctic cod. By contrast, the relationships between black-legged kittiwakes and northern fulmars, and black-legged kittiwakes and glaucous gull, were more tenuous. Our observations suggested that there was a mutual relationship in which black-legged kittiwakes and northern fulmars utilized cues of the other to locate and capture Arctic cod. This was evident from the higher association between black-legged kittiwakes and northern fulmars in the presence of Arctic cod schools (Table 3).
Seabirds did not significantly associate with shallow schools during the hydroacoustic survey, contradicting our second hypothesis. However, our observations suggested that seabirds frequently used depth as a cue, aggregating by schools that were close to the surface or nearshore. There are several possible reasons for the lack of correlation. First, the noise and presence of the survey boat may have caused Arctic cod to move to deeper water (Crawford & Jorgenson 1993). Second, the volume of water sampled near the surface is greatly reduced compared to deeper water because of the cone-shaped detection beam (Simmonds & MacLennan 2005). Third, both predator and prey are highly mobile and this type of survey provided a snapshot in space and time of a highly dynamic system. Fourth, the top 1.75 m of the water column could not be sampled due to limitations of the hydroacoustic equipment.
The spatial overlap between high predator–prey areas is dependent on the predators’ foraging spatial scale (Craig et al. 1982). We demonstrated that northern fulmars associated with schools of Arctic cod on a fine scale (<300 m2). This association was also apparent on a larger scale when there was a greater abundance of birds in the northern section of the study area compared to the south on 31 August. By aggregating in areas where schools of Arctic cod were present, northern fulmars maximized efforts allocated to predation and focused their energetic cost on readily captured Arctic cod. The distribution of black-legged kittiwakes was more independent of schools as they frequently fed on dispersed Arctic cod (Matley et al. 2012). Similarly, Piatt et al. (1989) found that black-legged kittiwake's density was not correlated with Arctic cod density at any depth stratum in coastal and offshore areas in the south-eastern Chukchi Sea.
Conclusion
Northern fulmars foraged on a fine scale in areas where Arctic cod were present. By contrast, the distribution of black-legged kittiwakes was not significantly dependent on schools, validating our first hypothesis. The implications of these specialized foraging behaviours are that black-legged kittiwakes spent more time in flight searching for prey compared to northern fulmars. However, black-legged kittiwakes captured more Arctic cod because they also fed on dispersed individuals (Matley et al. 2012). Our second hypothesis was rejected as the association between northern fulmars and black-legged kittiwakes with Arctic cod density, abundance and depth was not significant. Finally, glaucous gulls appeared to rely primarily on northern fulmars to feed on Arctic cod, validating our third hypothesis. Using the presence of schools and behaviour of other birds as foraging cues allowed the predators to capture Arctic cod that typically remained >5 m deep but occasionally swam to the surface, individually or in small schools. Arctic cod in satellite schools risked predation near the surface but this was likely outweighed by the benefit of reduced competition and perhaps an abundance of more suitably sized smaller prey organisms. Despite the limitation of our blanking range the acoustic beam still detected Arctic cod below 1.75 m and within the foraging depths of the surface-feeding birds. Further, it allowed us to determine how seabirds reacted to the presence of schools.
This study provided new insights about the feeding dynamics of marine predators on Arctic cod, and constitutes a starting point for future research. There are numerous small inshore areas like Allen Bay in the Canadian Arctic Archipelago and the energetic value of these local feeding events may be important in the ecosystem budget. Since there are numerous anecdotal reports of large-scale bird and mammal feeding events on Arctic cod, future studies should also focus on these large schools to further elucidate the relationship among predators and Arctic cod. More importantly, will the findings from Allen Bay hold up at larger scales or is foraging simply opportunistic and random? Further, will the distribution and behaviour of large schools, satellite schools and individual Arctic cod persist regardless of scale? The development of methods and dedicated surveys will help improve our knowledge of these predator–prey interactions at a broader scale.
Acknowledgements
We thank S. Simeone from Resolute for assistance in the field and allowing us to use his boat. We would also like to thank K. Gardiner, G. Lescord and T. Kirchner for advice and support. This research would not have been possible without the use of the Polar Continental Shelf Base and their staff including M. Bergmann, Y. Laroche and B. Eckalook, as well as the Hunters and Trappers Organization. Funding was provided by the Canada Foundation for Innovation, the National Sciences and Engineering Research Council of Canada and the Ocean Tracking Network to TD.
References
Akaike
H. 1974.
A new look at the statistical model identification. IEEE Transactions on Automatic Control 19,
716–723.
[Crossref]
Benoit
D.,
Simard
Y.
&
Fortier
L.
2008. Hydroacoustic detection of large winter aggregations of Arctic cod (Boreogadus saida) at depth in ice-covered Franklin Bay (Beaufort Sea). Journal of Geophysical Research—Oceans
113, C06S90, doi: 10.1029/2007JC004276.
[Crossref]
Benoit
D.,
Simard
Y.,
Gagne
J.,
Geoffroy
M.
&
Fortier
L. 2010.
From polar night to midnight sun: photoperiod, seal predation, and the diel vertical migrations of polar cod (Boreogadus saida) under landfast ice in the Arctic Ocean. Polar Biology 33,
1505–1520.
[Crossref]
Bradstreet
M.S.W.
&
Cross
W.E. 1982.
Trophic relationships at High Arctic ice edges. Arctic 35,
1–12.
Burnham
K.P.
&
Anderson
D.R. 2002. Model selection and multimodel inference: a practical information–theoretical approach. New York: Springer.
Cota
G.F.,
Prinsenberg
S.J.,
Bennett
E.B.,
Loder
J.W.,
Lewis
M.R.,
Anning
J.L.,
Watson
N.H.F.
&
Harris
L.R. 1987.
Nutrient fluxes during extended blooms of Arctic ice algae. Journal of Geophysical Research—Oceans 92,
1951–1962.
[Crossref]
Craig
P.C.,
Griffiths
W.B.,
Haldorson
L.
&
McElderry
H. 1982.
Ecological studies of cod (Boreogadus saida) in Beaufort Sea coastal waters. Canadian Journal of Fisheries and Aquatic Sciences 39,
395–406.
[Crossref]
Crawford
R.E.
&
Jorgensen
J.K. 1993.
Schooling behaviour of cod, Boreogadus saida, in relation to drifting pack ice. Environmental Biology of Fishes 36,
345–357.
[Crossref]
Crawford
R.E.
&
Jorgensen
J.K. 1996.
Quantitative studies of cod (Boreogadus saida) schools: important energy stores in the Arctic food webs. Arctic 49,
181–193.
Crawford
R.E.,
Vagle
S.
&
Carmack
E.C. 2012.
Water mass and bathymetric characteristics of polar cod habitat along the continental shelf and slope of the Beaufort and Chukchi seas. Polar Biology 35,
179–190.
[Crossref]
Davoren
G.K.,
Montevecchi
W.A.
&
Anderson
J.T. 2003a.
Distributional patterns of a marine bird and its prey: habitat selection based on prey and conspecific behaviour. Marine Ecological Progress Series 256,
229–243.
[Crossref]
Davoren
G.K.,
Montevecchi
W.A.
&
Anderson
J.T. 2003b.
Search strategies of a pursuit-diving marine bird and the persistence of prey patches. Ecological Monographs 73,
463–481.
[Crossref]
Elliott
K.H.,
Woo
K.,
Gaston
A.J.,
Benvenuti
S.,
Dall'Antonia
L.
&
Davoren
G.K. 2008.
Seabird foraging behaviour indicates prey type. Marine Ecological Progress Series 354,
289–303.
[Crossref]
Foote
K.G.,
Knudsen
H.P.,
Vestnes
G.,
MacLennan
D.N.
&
Simmonds
E.J. 1987. Calibration of acoustic instruments for fish density estimation: a practical guide. Technical Report 144. Copenhagen: International Council for the Exploration of the Sea.
Furness
R.W. 1987.
Kleptoparasitism in seabirds.
In J.P. Croxall (ed.): Seabirds: feeding ecology and role in marine ecosystems. Pp. 77–100. Cambridge: Cambridge University Press.
Garthe
S.
&
Furness
R.W. 2001.
Frequent shallow diving by a northern fulmar feeding at Shetland. Waterbirds 24,
287–289.
[Crossref]
Geoffroy
M.,
Robert
D.,
Darnis
G.
&
Fortier
L. 2011.
The aggregation of polar cod (Boreogadus saida) in the deep Atlantic layer of ice-covered Amundsen Gulf (Beaufort Sea) in winter. Polar Biology 34,
1959–1971.
[Crossref]
Gradinger
R.R.
&
Bluhm
B.A. 2004.
In-situ observations on the distribution and behavior of amphipods and Arctic cod (Boreogadus saida) under the ice of the High Arctic Canada Basin. Polar Biology 27,
595–603.
[Crossref]
Hobson
K.A.
&
Welch
H.E. 1992.
Observations of foraging northern fulmars (Fulmaris glacialis) in the Canadian High Arctic. Arctic 45,
150–153.
Hoffman
W.,
Heineman
D.
&
Wiens
J.A. 1981.
The ecology of seabird feeding flocks in Alaska. Auk 98,
437–456.
Hop
H.,
Welch
H.E.
&
Crawford
R.E. 1997.
Population structure and feeding ecology of cod (Boreogadus saida) schools in the Canadian High Arctic.
In J. Reynolds (ed.): Fish ecology in Arctic North America: proceedings of the Fish Ecology in Arctic North America Symposium, held at Fairbanks, Alaska, USA, 19–21 May 1992. Pp. 68–80. Bethesda, MD: American Fisheries Society.
Irons
D.B. 1998.
Foraging area fidelity of individual seabirds in relation to tidal cycles and flock feeding. Ecology 79,
647–655.
Logerwell
E.A.,
Hewitt
R.P.
&
Demer
D.A. 1998.
Scale-dependent spatial variance patterns and correlations of seabirds and prey in the southeastern Bering Sea as revealed by spectral analysis. Ecography 21,
212–223.
[Crossref]
Longhurst
A.R.,
Sameoto
D.
&
Herman
A. 1984.
Vertical distribution of Arctic zooplankton in summer: eastern Canadian Archipelago. Journal of Plankton Research 6,
137–168.
[Crossref]
Lønne
O.J.
&
Gulliksen
B. 1989.
Size, age, and diet of polar cod, Boreogadus saida (Lepechin 1773), in ice covered waters. Polar Biology 9,
187–191.
[Crossref]
Mallory
M.L.
&
Fontaine
A.J. 2004. Key marine habitat sites for migratory birds in Nunavut and the Northwest Territories Occasional Paper 110. Ottawa: Canadian Wildlife Service.
Matley
J.K.,
Fisk
A.T.
&
Dick
T.A. 2012.
Seabird predation on Arctic cod during summer in the Canadian Arctic. Marine Ecology Progress Series 450,
219–228.
[Crossref]
Mehlum
F.,
Hunt Jr.
G.L.,
Klusek
Z.,
Decker
M.B.
&
Nordlund
N. 1996.
The importance of prey aggregations to the distribution of Brunnich's guillemots in Storfjorden, Svalbard. Polar Biology 16,
537–547.
[Crossref]
Piatt
J.E.,
Wells
J.L.,
MacCharles
A.
&
Fadely
B.S. 1989.
The distribution of seabirds and fish in relation to ocean currents in the southeastern Chukchi Sea.
In W.A. Montevecchi & A.J. Gaston (eds.): Studies of high-latitude seabirds. 1. Behavioral, energetic, and oceanographic aspects of seabird feeding ecology. Occasional Paper 68. Pp. 21–31. Ottawa: Canadian Wildlife Service.
Pitcher
T.J. 1986. The behavior of teleost fishes. London: Croom Helm Publishing.
Simmonds
J.
&
MacLennan
D. 2005. Fisheries acoustics: theory and practice. Oxford: Blackwell Publishing.
Tasker
M.L.,
Hope Jones
P.,
Dixon
T.
&
Blake
B.F. 1984.
Counting seabirds at sea from ships: a review of methods employed and a suggestion for a standardized approach. Auk 101,
567–577.
Welch
H.E.,
Bergmann
M.A.,
Siferd
T.D.,
Martin
K.A.,
Curtis
M.F.,
Crawford
R.E.,
Canover
R.J.
&
Hop
H. 1992.
Energy flow through the marine ecosystem of the Lancaster Sound region, Arctic Canada. Arctic 45,
343–357.
Welch
H.E.,
Crawford
R.E.
&
Hop
H. 1993.
Occurrence of Arctic cod (Boreogadus saida) schools and their vulnerability to predation in the Canadian High Arctic. Arctic 46,
331–339.