RESEARCH/REVIEW ARTICLE
Photogrammetric methods applied to Svalbard glaciers: accuracies and challenges
Trond Eiken1
& Monica Sund1,2
1 Department of Geosciences, University of Oslo, PO Box 1047 Blindern, NO-0316 Oslo, Norway
2 Department of Arctic Geology, University Centre in Svalbard, PO Box 156, NO-9171 Longyearbyen, Norway
Abstract
Use of digital images is expanding as a tool for glacier monitoring, and small-format time-lapse cameras are increasingly being used for glacier monitoring of fast-flowing glaciers. Stereoscopic imagery is preferable since it yields direct displacement results but stereo photogrammetry has more requirements regarding geometry in set-up and control points, as well as the additional cost of another complete camera system. We investigate a combination of methods to achieve satisfactory control of accuracy with resulting significant day-to-day velocity variations ranging from 1.5–4 m day−1 made at a distance of 2 km. Validation of results was made by comparing different methods, partly using the same image material, but also in combination with aerial and satellite images. Monoscopic results can also be used to gain continuity in a stereo data set when geometry or visibility is poor. We also explore the use of ordinary photographs taken from airliners for compilation of orthoimages as a potential low cost method for detection of sudden changes. The method, showing some tens of metres accuracy, was verified for monitoring velocities and front positions during a glacier surge and was also used to validate monoscopic time-lapse images.
Keywords
Photogrammetry; time-lapse; orthoimage; mono- and stereoscopic; surge; velocity.
Correspondence
Trond Eiken, Department of Geosciences, University of Oslo, PO Box 1047 Blindern,
NO-0316 Oslo, Norway. E-mail: trond.eiken@geo.uio.no
(Published: 12 June 2012)
Polar Research 2012. © 2012 T. Eiken & M. Sund. This is an open-access article distributed under the terms of the Creative Commons Attribution-Noncommercial 3.0 Unported License (http://creativecommons.org/licenses/by-nc/3.0/), permitting all non-commercial use, distribution, and reproduction in any medium, provided the original work is properly cited.
Citation: Polar Research 2012, 31, 18671, http://dx.doi.org/10.3402/polar.v31i0.18671
Photogrammetry is a process of measuring objects in images, applying special techniques where the geometry of images is resolvable to perform precise measurements. Photogrammetry has been used to derive glacier velocity measurements for many decades, first utilizing medium- and large-format cameras (Finsterwalder 1931; Zagrajski & Zawadzki 1936; Pillewizer 1939; Voigt 1966). Automatic cameras in medium or small format were later used in time-lapse set-ups by, among others, Flotron (1973) and Krimmel & Rasmussen (1986). The introduction of small-format digital cameras, however, has enabled time-lapse photography at a reduced cost of both equipment and operation. So far digital single-lens reflex (SLR) time-lapse cameras have mainly been used for velocity measurements of fast-flowing glacier and automatic or semi-automatic tracking methods between images have been developed (Dietrich et al. 2007; Ahn & Box 2010).
In Svalbard, glaciers are generally slow-flowing, with relatively small displacements (e.g., Nuttall et al. 1997; Melvold & Hagen 1998; Sund & Eiken 2004; Blaszczyk et al. 2009) compared to many other regions. It is therefore challenging to use high time-resolution photogrammetry since the displacements, even on a monthly basis, can be smaller than the attainable accuracy. Nevertheless there are some fast-flowing glaciers, and a majority of the Svalbard glaciers are probably surge-type (Lefauconnier & Hagen 1991; Sund et al. 2009), meaning they quasi-periodically go through short periods of velocity increases up to 100 times the normal velocity, interspersed with longer periods of slow flow (Meier & Post 1969). During a surge, the glacier surface fractures more than normal due to the increased strain. Heavy crevassing reduces the possibilities of utilizing stakes on the glacier to measure its movement. However, crevasses provide good targets for photogrammetric measurements.
In this study, we explore a simple approach for deriving photogrammetric velocities using small-format digital cameras. First, we investigate which accuracies are obtainable for different temporal resolutions and how different methods may be used as validation in various settings on relatively slow-flowing glaciers. Second, we explore how ordinary digital images, for example, those taken with various cameras from airliners, can be utilized to achieve low-cost information on sudden events, such as glacier surges, when other sources are limited. Finally, this work provides the methodological foundation for subsequent work on glacier dynamics of the studied glaciers.
Study areas, set-ups and images
Single-lens reflex cameras in time-lapse configuration were deployed close to three different tidewater glaciers in Svalbard (Table 1). The midnight sun allows day-and-night photographic coverage of glacier activity during summer. In this study, terrain features have been used to identify ground control points (GCPs). Positions of trigonometric cairns on distant mountains, where the peaks are visible in the time-lapse images, are used as GCPs. Some well-defined terrain features have been used additionally, with coordinates measured in digital maps from the Norwegian Polar Institute (NPI). The accuracy of the GCPs used can at best be estimated to some metres.
Table 1 Image sources and camera set-up for the various locations. All camera boxes were equipped with camera, control unit, battery and solar panel. (The use of brand names in this paper is for identification purposes only and does not imply endorsement by the authors.)
| Glacier |
Image/camera |
Lens (mm) |
Image (mega-pixels) |
Set-up |
Distance (km) |
Interval |
Period/ epoch |
| Kronebreen Figs. 1, 2 |
Nikon D200 |
28 |
10 |
2 stereo |
0.5–3 |
6 h |
31 May–03 Aug 2008 |
| Comfortlessbreen Figs. 1, 2 |
Pentax K110 |
18 |
6 |
2 – no stereo |
0.5–2.7 |
2 h |
31 May–01 Aug 2008 |
|
Aerial photographs |
|
|
|
|
|
30 July 2008 |
|
QuickBird |
|
|
|
|
|
29 Aug 2008 |
| Nathorstbreen Figs. 1, 2 |
Pentax K200D |
23 |
10 |
1 |
4–ca. 10 |
2 h |
05 Apr–28 Aug 2009 |
|
Airliner photographs |
|
|
|
|
|
24 Mar–25 Sep 2009 |
Kronebreen is a fast-flow outlet glacier draining Dovrebreen, Holtedahlfonna and parts of Isachsenfonna, with a total area of 530 km2. Velocities measured at the terminus vary between <1 m day−1 and 4.5 m day−1 (Pillewizer & Voigt 1968). Two cameras were set up for stereoscopic coverage with a baseline topographically restricted to ca. 331 m at 375 m a.s.l. on the mountain Colletthøgda (Figs. 1a, b, 2), overlooking the calving front. The cameras were installed on tripods fastened with backstays and weighted down with rocks to minimize camera rotation.
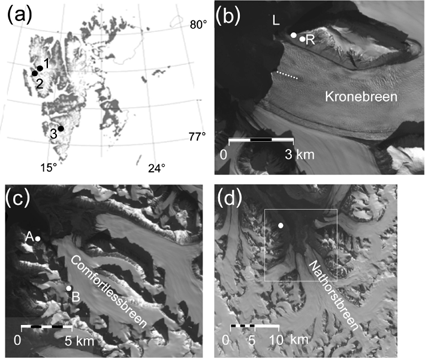
Fig. 1
(a) Svalbard, location of the study areas: (1) Kronebreen, (2) Comfortlessbreen and (3) Nathorstbreen. Camera set-up positions indicated with white spots; (b) Kronebreen, right (R) and left (L) camera, white dotted line indicate location of measured targets; (c) Comfortlessbreen, cameras A and B; (d) Nathorstbreen, size of frame inset corresponds to Fig. 12. Background images (b–d) are from the Système Probatoire pour l'Observation de la Terre (SPOT) Stereoscopic Survey of Polar Ice: Reference Images and Topographies (SPIRIT) programme, © Centre National d'Etudes, France (2007) and SPOT Image 2007 all rights reserved.
Comfortlessbreen, a valley glacier 44 km2 in area, is located in Engelskbukta, south of Ny-Ålesund (Fig. 1a). In 2008, the glacier was observed to be surging (Sund et al. 2009; Sund & Eiken 2010). Two cameras were located on nearby mountains to provide two monoscopic data sets. Camera A was set up at ca. 350 m a.s.l., enabling an inclined camera dip angle of 13° towards the glacier terminus; camera B covered a part of the central section of the glacier with the photographic axis perpendicular to the flow (Figs. 1c, 2c).
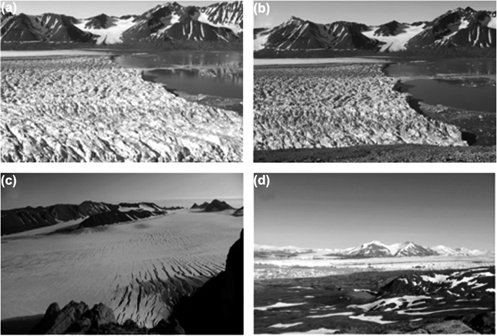
Fig. 2
Image frames at the various locations: (a) left camera at Kronebreen; (b) right camera at Kronebreen; (c) Comfortlessbreen camera B and (d) Nathorstbreen.
Aerial and satellite data sets were also used for Comfortlessbreen. Using a digital UltraCam-X (Vexcel Imaging, Graz, Austria), an NPI aerial photography campaign covered the glacier with two strips, for a total of 14 images. The frames are 136 megapixels in size, and the pixel size is 7.2 µm, for a ground sample distance (GSD) of 0.5 m. A QuickBird satellite image covering most of Comfortlessbreen was supplied by DigitalGlobe (Longmont, CO, USA); the image was georeferenced and orthorectified based on the 1990 1:100 000 map and digital terrain model (DTM) from the NPI. The DTM has 20-m cell size and 5-m estimated accuracy. The reported accuracy of the rectified QuickBird image based on GCPs is 10 m. Because the aerial and QuickBird images covered the same area and part of the same time period as the time-lapse images, we could compare velocities derived from a combination of the aerial and QuickBird images to velocities derived from the time-lapse images.
Approximately 400 km2 in area, Nathorstbreen is a glacier system that is currently surging (Sund et al. 2009; Sund & Eiken 2010), flowing out to the inner part of Van Keulenfjorden. The front comprises four main confluence glaciers: Dobrowolskibreen, Ljosfonn, Polakkbreen and Zawadzkibreen. One camera was located on a hillside ca. 3.5 km south-west of the terminus (Figs. 1a, d, 2d). Photographs of Nathorstbreen were taken with various cameras from commercial airliners between Longyearbyen and Tromsø. Finally, a SPOT 5 satellite orthoimage and DTM from the Système Probatoire pour l'Observation de la Terre (SPOT) satellite network, part of the French Space Agency's Stereoscopic Survey of Polar Ice: Reference Images and Topographies (SPIRIT) programme.
Methods
The time-lapse cameras on Kronebreen and camera B on Comfortlessbreen were set up near-perpendicular to the glacier flow. This approach enables measured displacements to be approximated to glacier displacement by a direct scaling. Because the other two cameras (Comfortlessbreen and Nathorstbreen) deviated from perpendicular photography, image coordinate displacements required a transformation to terrain coordinate system (Ahn & Box 2010) or a mapping function (e.g., Voigt 1966; Harrison et al. 1992) to calculate actual displacements. An alternate method, reprojecting time-lapse images to orthoimages to measure displacements directly in map projection coordinates, was also explored. Different parameters and data are required to develop the algorithms for the different methods.
As the objective of this study was both to map the velocities and to compare different methods, manual measurements in images were used to derive displacements for defined targets, to enable a comparison between stereoscopic and monoscopic results. Image correlation (Dietrich et al. 2007; Ahn & Box 2010; Kääb 2010) would probably have been less time-consuming and given a far denser coverage of observations, but would lack the reliable target identification achieved through manual measurements. For image measurements and photogrammetric processing we applied the Digital Photogrammetric Workstation (DPW) software of Intergraph Image Station. The software enabled measurement of image coordinates at sub-pixel level.
Image orientation
Orientation parameters of a time-lapse image are the combination of the position of the projection centre and the rotations of the image coordinate system relative to the ground coordinate system. Some or all the parameters are needed to transfer image coordinate displacements to terrain scale. Direct measurements of the orientation parameters of a camera are demanding. The position of projection centres can be surveyed within a few centimetres, but the direction of photography relative to the terrain coordinate system is very difficult to measure. We used resection, a mathematical algorithm based on the colinearity equations (e.g., Mikhail et al. 2001) to fix orientation parameters, with measured projection centre coordinates given as weighted parameters. This method works on any image geometry, and either mono- or stereoscopic set-ups, but requires a minimum of three—preferably more—well-distributed GCPs in the image for control. In a time-lapse series all the images from one camera have in theory the same orientation, if the camera set-up is stable, and orientation can be performed on one image set only. The prerequisites for a resection are known camera parameters, focal length, lens distortion, size of the sensor (charge coupled device [CCD]) and the pixel size of the CCD. Lack of or erroneous camera calibrations will introduce errors in the result. The two Kronebreen cameras were calibrated without environmental enclosure using PhotoModeler Pro 5 software. Calibrated focal lengths were found to deviate <0.4% from factory specifications, and distortions up to 30 µm at the margins were present for both cameras. Since the calibrations were considered incomplete without the environmental enclosure the corrections were omitted in the calculations.
Stereoscopic photogrammetry
The advantage of a stereoscopic time-lapse set-up is the possibility of extracting three-dimensional terrain coordinates directly, with corresponding displacements, but the geometric constraints can limit the accuracy. In a stereoscopic set-up the distance between camera positions is called the image base (B), which is combined with the distance to objects (D) to yield the B/D ratio, an important geometric factor describing achievable accuracy (Fig. 3). In aerial photography 60% overlap between successive images corresponds to a B/D ratio of ca. 0.6 with a standard wide-angle lens. The camera set-up on Kronebreen was limited to a short photographic base, resulting in B/D ratios below 0.2. A stereoscopic time-lapse set-up utilizing small-format digital cameras and very small image scales combined with a low B/D ratio, as in our case, will limit the achievable accuracy, especially in measuring distance from camera. Figure 3 shows that a low B/D ratio will reduce accuracy considerably. For example, an image from a standard SLR camera usually has a pixel size of ca. 6 microns. With an 18 mm wide-angle lens this gives a GSD of 0.33 m for 1-km photographic distance. If measurement accuracy is estimated as half the pixel size, accuracies perpendicular to the photographic direction is roughly 0.17 m. In the photographic direction the accuracy will depend on the B/D ratio, and with 100 or 600 m between cameras, i.e., B/D ratios of 0.1 and 0.6, the accuracy in photographic direction will be reduced from 1.7 to 0.28 m.
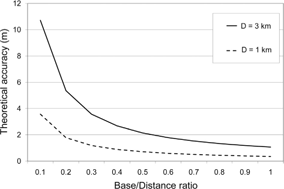
Fig. 3
Theoretical height accuracy of stereo measurements as a function of the base/distance (B/D) ratio. The relation is (D2·σpx/ B·f) where B is the base between cameras, D is the distance (height in vertical photography), f (focal length) is 28 mm and σpx (measurement accuracy of parallax) is 10 µm. The theoretical height accuracy corresponds to distance accuracy in a terrestrial image with a horizontal photographic axis.
Monoscopic measurements and image correlation
Measuring image coordinates of an object in a series of images from a monoscopic time-lapse camera is an alternative to the stereoscopic approach. The trajectory of a point on the glacier surface, hereafter called the target, was calculated as it appears on subsequent images taken over a period of time. Changes in object shape due to melt and variation of view angle due to motion are frequent problems in image measurements of a glacier surface. These effects limit both the precision in manual measurements and the success of image correlation.
Mapping function
To convert displacements measured in successive images we use a mapping function. If the displacements are horizontal and perpendicular to the direction of photography (Fig. 4), the X-image coordinate difference of a target in two different images (X2–X1)img gives the displacement in the image plane. The terrain displacement (D′) is found by scaling the image displacement, using distance over focal length as the scale factor:

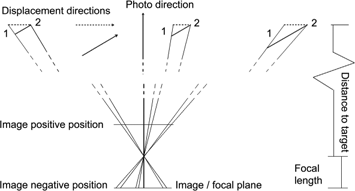
Fig. 4
Image measurements and object displacement varying with the direction of photography and direction of flow. The numbers 1 and 2 represents measurements of the same object in two different images in a time-lapse series.
If the displacement (D′) is not perpendicular to the direction of photography (Fig. 4), the image displacements have a variable scaling factor, which is dependent on the position of the target in the photograph (Voigt 1966):

where D′ is the assumed perpendicular displacement from (1), φ is the angle between the actual direction of flow and the direction perpendicular to the photographic direction and ϕ is the angle between the end point of displacement and the direction of photography.
The scaling magnitude increases rapidly with deviation of the target trajectory from the photographic direction (Fig. 5), and the mapping function must compensate for geometric variation (Voigt 1966; Harrison et al. 1992; Ahn & Box 2010). In a stereoscopic set-up, target distances are derived from the coordinate results. For a monoscopic camera set-up, however, distances must be found using other techniques. Errors in distance will give a linear scaling error to the displacements; a 20 m error at a 2 km distance will give a scale error of 1% on displacements. If the flow is not near-horizontal, a three-dimensional transformation is the better solution, but this requires height information from a DTM or other sources.
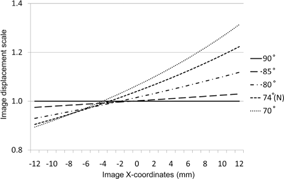
Fig. 5
Scale factors resulting from different angles between direction of photography and direction of flow for a 23 mm lens on a 24×16 mm charge coupled device. The figure corresponds to an image in positive position with flow from left to right, as illustrated in Fig. 4. The 74°(N) curve is for Nathorstbreen.
Orthoimages
Reprojection of the images to an orthoprojection is an alternate method that we tested on Comfortlessbreen. Orthoprojection compensates for distortions in images induced by topographical relief, but requires knowledge of orientation parameters of the images and a DTM of the area covered by the image (Wiesel 1985). Orthoimages enable direct conversion of plane coordinates into the map projection, and displacements can be measured directly from images of different epochs. Image correlation matching techniques can be applied as well. In this case the error propagation is more complex, as the image measurements, camera orientation and the DTM will influence the results. For Svalbard glaciers, the elevation variation over a season is minimal. Therefore, the errors of a given DTM will have minor influence on the day-to-day position of a target (and displacements), but will result in absolute systematic errors in the target's position.
Results
Stereoscopic velocities: Kronebreen
The time-lapse image series from the two Kronebreen cameras were taken at 6-h intervals; generally one daily set of images was used, preferably taken at the same time of day, with some exceptions due to clouds or fog. Altogether, 50 image pairs were measured, but many pairs lack control points due to clouds, and only eight sets could be used for stereoscopic results. The distant mountain GCPs were unfavourably located as they form a line in the upper part of the images, and additional GCPs at sea surface were added for height-only control. The exterior orientation parameters were solved only for the rotations, as the projection centres were determined by a kinematic global navigation satellite system survey with estimated accuracy of <2 cm.
A longitudinal profile of nine targets was measured in the images (Fig. 1b). Identification of the targets was sometimes difficult due to melting, variable illumination and changes in the shape of target objects. We computed the stereoscopic results using the same algorithm as in resection, but now in a combined adjustment with several images (often referred to as a bundle adjustment), with typical indicated accuracy of ca. 2 pixels (10–15 µm). The estimated standard deviations of calculated targets are especially high along the direction of photography, with typical values of 2 m along-glacier (approximately east), 6 m across-glacier (approximately north) and 2 m in height, as expected from the low B/D ratio of the set-up. The resulting displacement vectors have a high variability in direction. With the assumption that the direction of flow is known and constant, displacements were projected to the mean direction found, eliminating the effect of the erroneous distance component. The shortest stereoscopic measurement period, 1 day, had direction deviations of 16–79° from the seasonal average, and the resulting projecting corrections were 4–71%, indicating unreliable results (Table 2). The magnitude of deviating directions decreased for longer time spans. Ten days or more had 0–10° deviations, with <2% correction to displacement vectors. The results from time spans of 10 days or more also compare better with the corresponding monoscopic results. Differences were 2% or less for targets 5–9, increasing to 8–12% for the uppermost target 1. The targets closest to image centre in both images corresponded well, while the discrepancy increased towards the margin of the images, which is an indication of deformations present in the stereoscopic models. Deformations are caused by erroneous exterior orientation or uncompensated lens distortions.
Table 2 Accumulated displacements from stereoscopic (S) and single-image time-lapse measurements (TL) of Kronebreen for various periods. For stereoscopic results also the direction deviation in degrees (SD dev.°) to seasonal average is listed.
|
|
Target number |
| Period/day |
Obs. |
1 |
2 |
3 |
4 |
5 |
6 |
7 |
8 |
9 |
| 1–2 |
S (m) |
0.65 |
3.06 |
0.90 |
1.04 |
1.12 |
1.58 |
1.23 |
1.43 |
4.69 |
|
SD (dev.°) |
−19.7 |
54.2 |
16.5 |
19.8 |
17.4 |
40.7 |
−30.9 |
−51.7 |
79.1 |
|
TL (m) |
1.24 |
1.48 |
1.31 |
1.32 |
1.49 |
1.52 |
1.56 |
1.40 |
1.27 |
| 2–4 |
S (m) |
9.21 |
7.74 |
8.37 |
7.84 |
8.11 |
10.34 |
9.33 |
8.53 |
8.17 |
|
SD (dev.°) |
26.1 |
14.8 |
22.0 |
22.6 |
22.8 |
37.9 |
33.2 |
26.8 |
25.8 |
|
TL (m) |
4.97 |
5.01 |
4.95 |
4.55 |
4.80 |
5.22 |
5.24 |
5.28 |
5.12 |
| 4–11 |
S (m) |
10.15 |
10.12 |
10.26 |
9.92 |
10.60 |
12.35 |
12.63 |
11.90 |
11.21 |
|
SD (dev.°) |
−26.6 |
−20.3 |
−23.4 |
−17.4 |
−13.3 |
−26.6 |
−29.1 |
−19.4 |
−4.5 |
|
TL (m) |
14.16 |
13.87 |
13.68 |
12.94 |
13.40 |
14.28 |
14.12 |
13.99 |
13.80 |
| 11–13 |
S (m) |
7.81 |
6.98 |
6.80 |
4.79 |
6.17 |
7.86 |
6.98 |
6.68 |
5.55 |
|
SD (dev.°) |
32.6 |
28.1 |
28.8 |
2.7 |
28.9 |
38.8 |
36.2 |
34.1 |
−11.1 |
|
TL (m) |
4.25 |
4.23 |
4.16 |
3.75 |
3.86 |
4.50 |
4.26 |
4.30 |
4.36 |
| 13–23 |
S (m) |
18.81 |
20.50 |
19.48 |
19.00 |
19.90 |
22.41 |
21.78 |
21.50 |
21.49 |
|
SD (dev.°) |
−6.4 |
0.8 |
−8.1 |
−6.4 |
−11.5 |
−7.6 |
−11.9 |
−6.4 |
−3.3 |
|
TL (m) |
22.00 |
22.62 |
21.95 |
20.54 |
21.31 |
23.70 |
22.69 |
22.48 |
22.45 |
| 23–43 |
S (m) |
44.54 |
45.22 |
45.92 |
45.75 |
47.90 |
50.74 |
50.11 |
49.44 |
50.82 |
|
SD (dev.°) |
−6.4 |
−4.2 |
2.3 |
−0.5 |
1.4 |
−0.9 |
3.9 |
0.6 |
1.9 |
|
TL (m) |
50.29 |
49.76 |
48.68 |
47.74 |
49.08 |
52.08 |
50.93 |
50.44 |
51.82 |
| 43–61 |
S (m) |
47.22 |
47.96 |
45.87 |
48.13 |
52.90 |
53.10 |
51.74 |
52.89 |
54.80 |
|
SD (dev.°) |
−4.4 |
0.5 |
−7.6 |
5.5 |
−2.6 |
−0.3 |
0.4 |
−1.0 |
−1.3 |
|
TL (m) |
50.13 |
49.09 |
47.56 |
46.78 |
52.56 |
52.37 |
50.76 |
51.74 |
53.65 |
| 1–61 |
S (m) |
134.76 |
138.49 |
134.70 |
135.03 |
144.51 |
152.59 |
148.57 |
148.94 |
152.00 |
|
SD (dev.°) |
−3.1 |
0.7 |
−1.9 |
1.1 |
−0.5 |
1.0 |
0.7 |
−0.1 |
2.0 |
|
TL (m) |
147.04 |
146.06 |
142.27 |
137.62 |
146.48 |
153.67 |
149.57 |
149.63 |
152.48 |
Time-lapse monoscopic velocities
Kronebreen.
The image coordinates from the stereoscopic measurements at Kronebreen were also used to calculate daily displacements utilizing the monoscopic method. We tried to keep the direction of photography perpendicular to the flow, but deviations of −4.5° and +4.5° were found for the ca. 9° converging cameras. Using the simple mapping function (Eqn. 1) would yield an error of 7% at the uppermost target, so the function (Eqn. 2) was used. The average distance to targets for each camera from the stereoscopic results was applied. Distance changes are neglected, since they were <2% during the period. The displacement of targets and error estimate was calculated from day-to-day for the entire series of simultaneous images from the left and right cameras (Fig. 6).
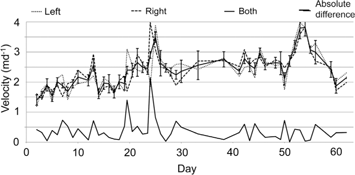
Fig. 6
Daily mean velocities (nine targets) from left and right camera on Kronebreen. Average from both cameras and absolute difference. Error bars on daily means indicate standard deviation of daily average of the nine targets measured.
The camera stability was evaluated using the measured GCPs, when visible, and daily relative rotations were estimated (Fig. 7), confirming the variations found in the stereoscopic orientations. The left camera had small rotations both in the horizontal and vertical direction, while the right camera had a drift of more than 0.1 g in both horizontal and vertical directions during the season. The horizontal rotation corresponds to a total error of ca. 3 m in the displacements over the season, or ca. 2.5%. Displacement results are corrected based on the observed horizontal rotations. The vertical rotations found (Fig. 7), especially for days 18, 24 and 41–43, when there was a temporary downward tilt of the cameras of nearly 0.05 g, might be explained by variations in atmospheric refraction, rather than physical rotation of the cameras. Refraction from temperature gradients and inversion layers are not uncommon in Svalbard and may explain such variations. The glacier surface flow is near horizontal, and the Y-component (in image coordinate space) is not used for computing displacements so vertical rotations have no influence. However, in situations where displacements are not near-horizontal and perpendicular to the photographic direction, this might be a source of error to be considered.
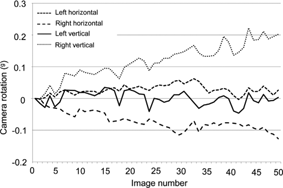
Fig. 7
Relative horizontal and vertical average rotations in left and right camera at Kronebreen, derived from measurements of distant control points.
Velocities derived from the left and right camera corresponded well on most days (Fig. 6), with a mean difference of 0.01 m and a standard deviation (σ) of 0.53 m (absolute average 0.38 m, σ 0.37 m). Some large differences between the left and right photographs occur, especially on 22 and 26 June (images 18 and 24 in Fig. 7). Both days have considerable vertical rotations and the observations were also based on a 12-h instead of 24-h time span (due to clouds), but the exact source of discrepancy was not found. The accumulated displacements for the entire summer amount to <1% difference between the two cameras, for a total displacement of ca. 150 m (Table 2).
Comfortlessbreen.
For the time-lapse series from camera B at Comfortlessbreen (Fig. 2c), the same method as on Kronebreen was used. However, with images from only one camera it was impossible to derive distances, so the mapping function distances were estimated by identifying the position of crevasses used as target points in the QuickBird image and in orthophotography compiled from the 2008 aerial photographs.
Targets forming a cross profile near the direction of photography were measured for 9 days at the end of the QuickBird–aerial period. Average daily velocities of ca. 1–2 m day−1 were calculated using both methods (Fig. 8b) and were found to agree to within <10%. Some differences are to be expected as different targets are used in the two methods, and there is a considerable variation in velocity across glacier, especially in the area close to the camera.
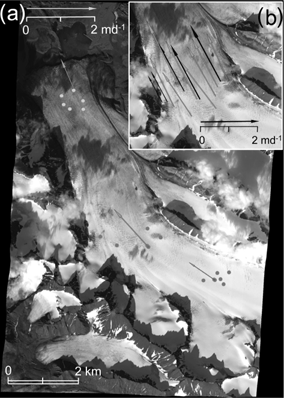
Fig. 8
Comfortlessbreen: (a) Mean velocities derived from crevasse tracking in aerial and QuickBird images in frontal, lower and middle part of the glacier; (b) Cross-profile velocities from camera B (grey) compared with aerial photograph–QuickBird results.
Nathorstbreen.
In the time-lapse series from Nathorstbreen, image coordinates of some features could be measured on a near day-to-day basis. Identification of targets proved easy on the crevassed surface. Distances to targets were estimated from the NPI map and by using the orthoimages from the commercial air flights. The direction of photography was at an estimated incidence angle of 74° to the glacier flow, and the mapping function (Eqn. 2) was used. Targets along and across glacier (Fig. 9d) were selected. The cross profile was measured at five different distances ranging from 4.1 to 7.2 km, with two nearby targets measured at each distance, selected to represent similar velocities. Mean velocities vary from 18 to 28 m day−1 (Fig. 10). Differences between pairs over 3 days in a row fit to within ca. 1 m, with one exception, where the difference is ca. 3 m. The length profile had some daily variations (Fig. 11) caused by measurement inaccuracies or detached ice-blocks moving. Yet, the profile yields a consistent average velocity of 24 m day−1. No trend in velocity differences along the profile or between days is found. The standard deviation of all measurements, given a constant velocity for all targets is 2 m, corresponding to ca. 1 pixel in image scale. Distances to targets were 5.3–6.7 km; these long distances limit the accuracy through reduced measurement accuracy and high image-to-terrain scale.
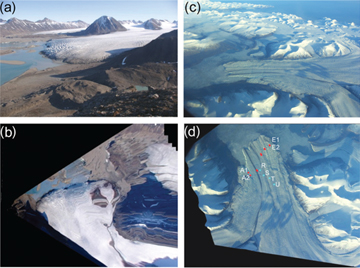
Fig. 9 (a) Comfortlessbreen, frame from camera A and the resulting orthophotograph: (b). (c) Nathorstbreen frame from airliner in September and (d) the resulting orthophotograph. A1, 2–E1, 2 indicate target pairs in transversal profile, while R–U are targets in the longitudinal profile.
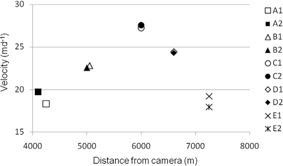
Fig. 10
Nathorstbreen: cross-profile velocities derived from time-lapse camera. Three-day average velocities for neighbouring target pairs A1, 2–E1, 2. See Fig. 11d for location of the targets.
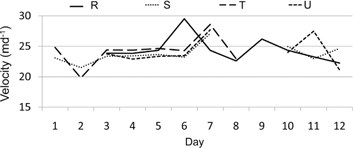
Fig. 11
Nathorstbreen: longitudinal profile velocities derived from time-lapse camera. Day-to-day velocities for targets R–U. See Fig. 11d for location of the targets.
Orthoimages from time-lapse images
Camera A at Comfortlessbreen had a photographic direction of ca. 60° to the flow, and 13 usable images were collected in the period 30 August–16 September 2008. The distance to the margin was ca. 1400 m (Fig. 9a), the scale in image centre ca. 1:80 000 and the GSD ca. 0.6 m. The inclined photographic direction and the sloping front complicate the use of a mapping function. As an alternative to the direct method described above, an attempt was made to create orthoimages and use these for displacement measurements.
Exterior orientation parameters were obtained by resection with approximate projection centre coordinates from a handheld GPS. A number of distant mountains with trigonometric cairns were used as GCPs, with some additional terrain details digitized from the NPI map. Only the first half of the image series had sufficient GCPs visible. Resections gave up to 2° variation in orientation parameters, with standard deviations as high as 30–50 µm as a result of distant, poorly distributed and defined GCPs, combined with an unstable camera set-up. Variations in the image coordinates confirm the instabilities.
A test set of orthoimages was generated using one set of orientation parameters for all images, even if rotations were present, to enable use of several images in which clouds masked the GCPs. We used a DTM generated from the 2008 aerial survey (Table 1), made a few weeks prior to the time-lapse images. The generation of a usable orthoimage requires an incidence angle between rays from camera and imaged surface. Too low incidence angle will cause “smearing out” of the image pixels, resulting in a blurred and unusable orthoimage. The actual images gave only limited areas usable for measurements (Fig. 9a, b), as large areas on the far side of the glacier were completely distorted. An attempt using five foreground checkpoints in a transformation to get better correspondence between orthoimages was only partially successful. The accuracy in the transformations was <1 m between the first four images, but even if the results were improved, the more distant areas from camera still showed erroneous displacement vectors from day-to-day, and no consistent results were achieved.
Oblique photographs from airliner: Nathorstbreen
Due to the remote location of Nathorstbreen, an attempt was made to use photographs (Fig. 9c) taken on the regular flights between Longyearbyen and Tromsø to obtain information on the ongoing surge. Photographs taken with various digital cameras on several flights during 2009 were tested for orientation by resection, and several successful orthoimages were generated for the lower part of the glacier system. Terrain features picked from a digital map were used as GCPs. No camera calibrations were applied and the focal length was taken directly from the Exchangeable Image File Format (EXIF) information of the images. Orthoimages with 5 m GSD were compiled (Fig. 9d) using a 2008 DTM from SPOT 5 imagery (Bouillon et al. 2006; Korona et al. 2009). The DTM, from just before the glacier surge started (Sund et al. 2009), obviously could have differences of up to 100 m in the area of the advancing front, where ice elevations now are at 50–100 m instead of sea level. Upglacier on the pre-surge glacier surface, DTM differences are below 50 m. The contribution from the DTM error was estimated to not exceed 100 m at the advanced front. The flights followed mostly the same path and photographs were taken in approximately the same horizontal direction with glacier area <20–30° off nadir. A nadir offset angle of 20° introduces a horizontal error of ca. one-third of the total DTM error, or ca. 30 m. DTM error will displace targets in the direction of photography, and as most photographs are taken in the same direction, the relative image error is smaller. The glacier front's intersection with the sea surface will have no DTM error, as the elevation is 0 m.
To evaluate the accuracy of the method, we use a set of five oblique images taken from different positions during one flight. The focal lengths vary from 18 to 55 mm. Flying heights were 7000–7900 m according to the resection results. Dip angles were 12°–21° and scales at the image centres of 1:600 000–1:1200 000 or GSD of ca. 3.5–7 m. Scale variations are considerable due to the oblique geometry. The resections gave standard deviations of 20–40 µm, and typical 20–40 m average errors in the GCPs. The values correspond well with the interpreted accuracy in the measurements, as points were not exactly defined and errors at this magnitude show the level of accuracy using this type of GCPs. The extent to which lens distortion and the influence of the airplane windows contributes to these errors is unknown.
A set of 58 targets were, with some exceptions, measured in the five orthoimages and used for estimating accuracy. Average residuals of measured targets was ca. 75 m for all measurements with gross errors removed, and 58 m when only well defined targets were considered. Some common points to the 2008 SPOT 5 image gave <70 m RMS difference when the SPOT 5 is considered as the true value. Even if this is a modest result concerning accuracy, the method is applicable on fast-flowing glaciers where other sources of information are lacking.
Orthoimages from March and September images (Table 1) were used to extract front changes and velocities. Differences between front positions (Fig. 12) indicate velocities of 15–20 m day−1. Identification of features on the glacier surface gave velocities varying from ca. 15 m day−1 up-glacier to ca. 23 m day−1 close to the front.
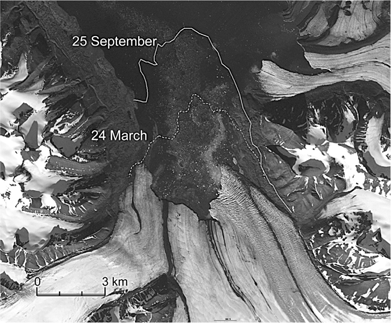
Fig. 12
Nathorstbreen: front positions compiled from orthophotographs from airliners in 2009. The background image is from SPOT 5, 1 September 2008.
Repeated vertical images: Comfortlessbreen
The 2008 NPI aerial images were used for compilation of a new DTM and a mosaic orthophotograph, based on orientation data from in-flight recorded position and altitude measurements. Glacier displacement between the epochs was derived from measurement of corresponding crevasse positions in the aerial orthophotograph and the QuickBird image. The general trend of the flow is nearly uniform across glacier, while a distinct velocity increase appears between the middle and lower sections. (Fig. 8a, Table 3). To evaluate the accuracy some groups of neighbouring targets have been compared in the middle, lower and terminal parts of the glacier, with average velocities of 1.17 m day−1 (σ=0.05 m), 1.86 m day−1 (σ=0.07 m) and 2.06 m day−1 (σ=0.07 m). The QuickBird image and aerial orthophotograph were also compared with a set of corresponding checkpoints in non-glaciated areas (mainly high mountain areas); no significant difference in scale or rotation was found. A rather high average root mean square of 2.8 m was found between the two sets, but compared to the reported QB georeferencing precision it was considered a good result. This might be a result of the checkpoints being mostly located in mountainous areas where DTM errors contribute most, but which have less influence on the glacier surface. Compared to glacier displacements of ca. 50 m during the period, this error contribution is <5%.
Table 3 Displacement of measured target groups in the middle, lower and frontal part of Comfortlessbreen (see Fig. 8 for location of the targets) derived from crevasse tracking in orthophotographs derived from aerial photographs and QuickBird imagery. Avg is average and SD is standard deviation of displacement.
| Point number/displacement (m day−1) |
Avg |
SD |
| F1 |
F2 |
F3 |
F4 |
F5 |
F6 |
|
|
| 2.05 |
2.03 |
2.11 |
2.06 |
1.95 |
2.16 |
2.06 |
0.07 |
| L1 |
L2 |
L5 |
L4 |
L5 |
L6 |
|
|
| 1.86 |
1.86 |
1.95 |
1.80 |
1.79 |
1.87 |
1.86 |
0.07 |
| M1 |
M2 |
M3 |
M4 |
M5 |
M6 |
|
|
| 1.23 |
1.11 |
1.18 |
1.20 |
1.14 |
1.14 |
1.17 |
0.05 |
| F, front; L, lower; M, middle. |
Discussion
This study mainly investigates the implication of deriving velocities from relatively slow glaciers by mean of small format cameras not calibrated for photogrammetric use and for which technical specifications have been taken from manuals and camera data from electronic metadata. Camera calibration errors will influence results and the magnitude of errors varies with the equipment and type of use. Monoscopic time-lapse series will have minor influence from calibration errors as day-to-day measurements are taken in the same area of the image, and the difference in distortion will be minimal. In a stereoscopic set-up, the calibration is far more important as the homologous rays have different origin and distortion in the two images. Ideally, a time-lapse camera should be calibrated installed in the environmental enclosure used for field measurements. This was not done so the effects of absent calibration could not be examined. Instead, we focus on the glaciological results from a typical image.
Errors introduced from snowmelt and changing light
Natural features on the glacier surface, as used in this study, do not form sharply defined targets. Melting of snow and ice on the surface introduces changes of features between images, making it difficult to identify and measure exactly the same detail during a time series. Changing shadows during day and sun elevation during summer season, as well as overcast days, change the appearance of a target considerably. On heavily fractured glacier surfaces the crevasse pattern changes appearance during the day to such a degree that it may not be possible to find the same features at the different times. These variations are challenging for both manual and automatic tracking. On Kronebreen, which has a heavily crevassed surface, the day-to-day measurements of individual features proved difficult, especially across image time gaps due to fog, for example. The differences in time-lapse image series from the left and right camera are partly a result of different incidence angle to features, as described by Dietrich et al. (2007). On the intensely fractured Nathorstbreen it was less difficult to identify targets as the direction of photography was closer to horizontal and the pinnacle targets did not undergo changes between images.
Measurement precision
Sub-pixel level measurement accuracy and pixel sizes of, for example, 6 µm in digital images may appear impressive compared to traditional photographic images, where achieved precision often are reported to 10–50 µm in image scale (e.g., Kääb et al. 1997). The small size of the CCD arrays in low cost digital cameras causes small image scales, and even if the pixel size is small, the corresponding terrain distance is substantial. We especially experienced difficulties in exact measurements of distant GCPs, as the area covered by one pixel could be 2×2 m or more at 10 km distance, obscuring exact details. The time-lapse series on Kronebreen, Comfortlessbreen and Nathorstbreen all indicate accuracies of ca. 1 pixel in image scale (ca. 6 µm) corresponding to ca. 0.21–0.33 m at 1 km distance with 28 or 18 mm lenses. Longer focal length is an advantage as image scale increases. Krimmel & Rasmussen (1986) noted the focal length should be selected to balance the field of view, velocities and distance to targets. Longer focal lengths improve image scale and resolution, and, hence, accuracy, but the field of view must include stable terrain features to maintain control of image rotations and eventually GCPs. On the relative slow flowing Kronebreen, velocity variations on the day-to-day level might be difficult to detect with this level of accuracy, as the level of significance will be nearly as high as the velocity variation for a set-up with a distance of 2 km. Compared to earlier studies of the same glacier using large-format photographic theodolites (see Voigt 1966; Melvold 1992), the small image format of the digital SLR cameras is a disadvantage. Digital SLR cameras with full-size CCD enable an image scale increase of 50% given the same field of view and should therefore be considered even if more expensive. Dietrich et al. (2007) reported precisions of 0.1–0.3 pixel from image matching, indicating that image matching can probably deliver higher precision than manual measurements in images. The advantage of manual measurements is that it is possible to achieve results in areas in which automatic matching has limited success. The main benefit with automatic matching is the high number of targets acquired over the image with limited manual work and, possibly, with more consistent accuracy.
Camera stability
Problems with camera instability and rotations between images in a time-lapse series are described by several authors (Harrison et al. 1986; Krimmel & Rasmussen 1986; Harrison et al. 1992; Dietrich et al. 2007; Ahn & Box 2010). Small rotations can be induced by temperature changes, even if the set-up is firmly fixed to bedrock. In permafrost conditions, a stable set-up seems nearly impossible with active layer melting and creeping, especially during the summer. Stable and well-defined check or control points are vital to verify and eventually correct camera rotations. We experienced that both cameras on Kronebreen had some similar daily variations in rotations and believe this is the result of atmospheric refraction; control points were relatively distant and changes in atmospheric refraction can be up to 1 m at 10-km distance (Bomford 1980). Foreground GCPs, as utilized by Dietrich et al. (2007), are preferable as the atmospheric effects are minimized and more stable orientation parameters can be derived.
Mono- and stereoscopic methods
Accurate distance to features is critical to the success of the monoscopic method, as image measured displacements scale with distance. Relative distance errors will propagate directly to displacements, and measurement errors will scale similarly with a decrease in precision by distance as result. A stereoscopic set-up (as on Kronebreen) can fix coordinates and hence distance to targets, and even with a modest geometric set-up achieve distance accuracies of ca. 1%. On Comfortlessbreen, however, the short-term velocities are derived from image measurements from one camera only (Fig. 2c), and distances measured in the orthophotograph. Accuracies in distances are variable. Targets close to camera were identified quite exactly while distant targets remained less accurate. Overall accuracy in distances was estimated to be better than ca. 5%.
Orientation of the stereoscopic images at Kronebreen could be performed only from nearly clear-sky images as areas with GCPs and stable control points were otherwise absent. On the other hand, the monoscopic method could be used when only the glacier surface was visible. This gave a considerably higher number of observations than the stereoscopic method, and the two methods complement each other under such conditions. The stereoscopic results had high estimated standard deviations a result of both GCP accuracy and geometry, and unfavourably low B/D ratio of 0.17. The consistency of the results nevertheless proves to be better than expressed by the estimated precision. The displacement vectors have a high variability in direction, a result of the weak geometry in distance from camera. With the assumption that the direction of flow is known and constant, the displacements were adjusted by projecting to the mean direction found. Daily monoscopic and longer term stereoscopic results for Kronebreen were compared. The projected displacement from first to last measurement corresponded to within <1%, with the mean monoscopic results for the targets in the central part of the image, while it increased towards the image margin to 8% difference on target 1. Considering the indications from calibration, and the uncertainty introduced by the extra layer of glass in the environmental enclosure, increased distortions towards the image margin are probable, and only a calibration with the complete environmental enclosure can give reliable results regarding calibration. Averaged or accumulated data for 10 days or more corresponds well both between left and right monoscopic results and to stereoscopic results. In the day-to-day calculation (Fig. 6), the results from the two cameras show less correspondence, pointing to some misidentifications of targets, even if extra careful controls were performed. The average accuracy in daily left and right results were estimated to 0.8 pixels, comparable to Ahn & Box's (2010) results with theoretical comprehensive error budget estimates of ca. 0.5 pixels. Results from camera B of Comfortlessbreen were compared to the overlapping period of the aerial–QuickBird comparison, and corresponds within 10% of the daily velocities in the same area. This also confirms the estimates from Kronebreen of accuracies better than 1 pixel in image scale.
Camera A in front of Comfortlessbreen proved to be a difficult site, due to camera instability, distant available GCPs, and an unfavourable geometric set-up with respect to the direction of photography relative to glacier flow. The attempt to generate orthoimages from the time-lapse series was not successful, as it was not possible to extract orientation parameters with the necessary accuracy. The combined effect of low incidence angle to the surface and inaccurate orientation parameters made the resulting orthoimages unusable for precise measurements. An incidence angle of 20° or more improves the image quality and slightly reduces the constraint to orientation parameters and is therefore recommended.
A second challenge is the vertical component in the day-to-day displacement combined with the angle between photographic direction and glacier flow as the “simple” mapping function assuming horizontal flow is not valid, and extraction of three-dimensional displacements from two-dimensional image data needs additional DTM elevations to establish a transformation. We have not explored this task any further in this work.
Orthoimages: Nathorstbreen
The use of randomly acquired oblique photographs from thousands of metres altitude as on Nathorstbreen proved to give results with some tens of metres accuracy. Two primary factors limit the accuracy: the GCPs and camera parameters. Identifying trigonometric points and terrain features accurately proved difficult, as did achieving a sufficient distribution of GCPs over the covered areas. An orthoimage or high-resolution satellite image could provide a better source of GCPs, if available, than does a map. Utilizing calibrated cameras with known focal lengths and distortion parameters of lenses, would also improve the accuracy, compared to the use of EXIF data and neglecting the effect of lens distortion. Nevertheless, it also partly excludes the use of randomly available photographs from the airliner on days with good weather conditions, restricting the exploitation of available data. The extent to which photographing through airplane windows distorts images requires further research.
The velocities derived from the advancing front is 20–30% lower than the velocities observed in the central part of the cross profile from the time-lapse images (Fig. 10), which is mostly attributed to the calving component. The features measured near the front in the March–September orthoimages coincide with the area covered by the time-lapse cameras and indicate near identical values. Measured velocities are in the range of those previously reported during surges in Svalbard (e.g., Liestøl 1969; Dowdeswell & Benham 2003; Murray et al. 2003). Compared to the use of daily available satellite images, such as those of the Moderate Resolution Imaging Spectroradiometer (Sund & Eiken 2010), a far better ground resolution was achieved by using photographs from the airliners. The estimates of precision indicate that orthoimages created from random photographs from airliners could be an alternative when other sources of information are unavailable or expensive. The method clearly has some limitations, but can be a cost-efficient way of extracting velocities or changes where this level of accuracy is sufficient.
QuickBird and aerial images: Comfortlessbreen
The correspondence between the QuickBird image and the orthophotograph was not as good as expected, indicating that georeferencing using map features probably does not fully exploit the precision of the QuickBird image. The observed difference between the two images is partly the result of nearly all the checkpoints being located in mountainous areas, where DTM errors are great, and from residual errors from the georeferencing of the QuickBird image. In the glacier area the 1990 DTM used is off by 30 m or more, as a surge had already developed by 2008 (Sund et al. 2009). The QuickBird image is acquired with a 14.7° mean off-nadir angle, resulting in about 20% of DTM error propagating to horizontal error in the orthoimage. The glacier surface is relatively flat and changes between 1990 and 2008 are continuous over larger areas, such that DTM errors are approximately constant in adjacent areas on the glacier. Differences are greater across the glacier, perpendicular to satellite azimuth, with errors mainly affecting the direction of flow. Using the 2008 aerial photograph DTM for the QuickBird image would perhaps yield better results, but this was not in any case an option as the QuickBird image was only available as a final product. The results achieved are consistent, with standard deviations of around 4% of measured displacements.
Conclusion
We have investigated and here describe some common problems arising during photogrammetry measurements applied on Svalbard glaciers. The use of time-lapse photography has increased in recent years, as it is a simple method to collect data with commercially available equipment. Camera set-up remains a challenge, as even minor instabilities propagate to the images. Targets close to cameras for control of rotations are an advantage; nearby targets also eliminate the effect of atmospheric refraction, which may introduce errors for distant GCPs.
The combination of mono- and stereoscopic image measurements from the same set of images proved to be efficient and complementary, allowing us to derive the necessary orientation parameters for images, the distance to targets and estimates of accuracy from the independent methods. Time-lapse results were also compared with velocities derived from crevasse tracking on different image sources, yielding consistent results with velocities of 2 m day−1.
Single-lens reflex time-lapse cameras and image measurements can lead to precision at the level of 1 pixel or better in image scale. The photographic distance from the camera to the feature and the focal length should be optimized to achieve the desired precision. On Kronebreen, time-lapse images proved to give accuracy sufficient to achieve significant day-to-day velocity variations of 1.5–4.5 m day−1 at a distance of 2 km.
At Comfortlessbreen, an attempt to generate orthoimages from terrestrial images with c. 13° inclination was unsuccessful, both because of unstable camera mounting, geometrically imperfect control points, and low inclination angle. With inclination angles of at least 20° this is an efficient method for extracting terrain velocities, even on more complex geometrical set-ups.
A new approach utilizing small-format images taken with inexpensive digital cameras during commercial airliner flights was tested and proved usable for generating orthophotographs. Extracted displacements gave results accurate to some tens of metres. This is a modest result with respect to accuracy, but because the method can measure changes of ca. 100 m or more it is potentially a valuable source of information when other sources are lacking.
Acknowledgements
We are grateful for support from the Svalbard Science Forum in the form of an Arctic Fieldwork Grant and from Svalbard's Environmental Protection Fund, which paid for a camera. Thanks to B. Barstad for valuable comments on the manuscript, to H. H. Christiansen and H. Juliussen for lending us their camera on short notice, to photographers, especially C.H. von Quillfeldt and S. Jacobsen, and to Scandinavian Airline System pilots for their help in obtaining photographs from the commercial aircraft. We also thank reviewers J. Box and M. Nolan and the journals’ Subject Editor for careful and constructive comments, which were greatly appreciated. SPOT 5 high-resolution stereoscopy data are courtesy of the French Space Agency's SPIRIT programme. The QuickBird image by Digital Globe used in this study was provided for a project carried out by the Norwegian Centre for Space-related Education. The 1990 DTM is courtesy of the Norwegian Polar Institute. We thank all for kindly providing data. This work was carried out as a contribution to the International Polar Year project Dynamic Response of Arctic Glaciers to Global Warming (GLACIODYN), funded by the Research Council of Norway, grant no. 176076/S30.
References
Ahn
Y.
&
Box
J.E. 2010.
Instruments and methods: ice velocities from time-lapse photos: technique development and first results from Extreme Ice Survey (EIS) in Greenland. Journal of Glaciology 56,
723–734.
[Crossref]
Blaszczyk
M.,
Jania
J.A.
&
Hagen
J.O. 2009.
Tidewater glaciers of Svalbard: recent changes and estimates of calving fluxes. Polish Polar Research 30,
85–142.
Bomford
G.
1980. Geodesy. 4th ed. London: Oxford University Press.
Bouillon
A.,
Bernard
M.,
Gigord
P.,
Orsoni
A.,
Rudowski
V.
&
Baudoin
A. 2006.
SPOT 5 HRS geometric performances: using block adjustment as a key issue to improve quality of DEM generation. Journal of Photogrammetry and Remote Sensing 60,
134–146.
[Crossref]
Dietrich
R.,
Maas
H.-G.,
Baessler
M.,
Rülke
A.,
Richter
A.,
Schwalbe
E.
&
Westfeld
P.
2007. Jakobshavn Isbræ, West Greenland: flow velocities and tidal interaction of the front area from 2004 field observations. Journal of Geophysical Research—Earth Surface 122, F03S21, doi: 10.1029/2006JF000601.
[Crossref]
Dowdeswell
J.A.
&
Benham
T.J. 2003.
A surge of Perseibreen, Svalbard, examined using aerial photography and ASTER high resolution satellite imagery. Polar Research 22,
373–383.
[Crossref]
Finsterwalder
R. 1931.
Geschwindigkeitsmessungen an Gletschern mittels Photogrammetrie. (Glacier velocity measurements using photogrammetry.) Zeitschrift fur Gletscherkunde 19(4–5),
251–262.
Flotron
A. 1973.
Photogrammetrische Messung von Gletscherbevegungen mit automatischer Kamera. (Photogrammetric measurements of glacier movements with automatic cameras.). Vermessung, Photogrammetrie und Kulturtechnik 71,
15–17.
Harrison
W.D.,
Echelmeyer
K.A.,
Cosgrove
D.M.
&
Raymond
C.F. 1992.
The determination of glacier speed by time-lapse photography under unfavourable conditions. Journal of Glaciology 38,
257–265.
Harrison
W.D.,
Raymond
C.F.
&
MacKeith
P. 1986.
Short period motion events on Variagated Glacier as observed by automatic photography and seismic methods. Annals of Glaciology 8,
82–89.
Kääb
A.
2010.
Aerial photogrammetry in glacier studies.
In P. Pellikka & W.G. Rees (eds.): Remote sensing of glaciers. Pp. 115–136. Boca Raton, FL: CRC Press.
Kääb
A.,
Haeberli
W.
&
Gudmundsson
G.H. 1997.
Analyzing the creep of mountain permafrost using high precision aerial photogrammetry: 25 years of monitoring Gruben rock glacier, Swiss Alps. Permafrost and Periglacial Processes 8,
409–426.
[Crossref]
Korona
J.,
Berthier
E.,
Bernard
M.,
Rémy
F.
&
Thouvenot.
E. 2009.
SPIRIT. SPOT 5 stereoscopic survey of polar ice: reference images and topographies during the fourth International Polar Year (2007–2009). Journal of Photogrammetry and Remote Sensing 64,
2823–2830.
[Crossref]
Krimmel
R.M.
&
Rasmussen
L.A. 1986.
Using sequential photography to estimate ice velocity at the terminus of Columbia Glacier, Alaska. Annals of Glaciology 8,
117–123.
Lefauconnier
B.
&
Hagen
J.O.
1991. Surging and calving glaciers in eastern Svalbard. Norsk Polarinstitutt Meddelelser 116. Oslo: Norwegian Polar Institute.
Liestøl
O. 1969.
Glacier surges in West-Spitsbergen. Canadian Journal of Earth Sciences 6,
895–897.
[Crossref]
Meier
M.F.
&
Post
A. 1969.
What are glacier surges? Canadian Journal of Earth Sciences 6,
8907–8917.
Melvold
K.
1992. Studie av brebevegelse på Kongsvegen og Kronebreen, Svalbard. (A study of glacier movement on Kongsvegen and Kronebreen, Svalbard.) Rapportserie i Naturgeografi 1. Oslo: University of Oslo.
Melvold
K.
&
Hagen
J.O. 1998.
Evolution of a surge-type glacier in its quiescent phase: Kongsvegen, Spitsbergen, 1964–95. Journal of Glaciology 44,
394–404.
Mikhail
E.,
Bethel
J.
&
McGlone
J.C.
2001. Introduction to modern photogrammetry. New York: John Wiley & Sons.
Murray
T.,
Strozzi
T.
&
Luckman
A.
2003. Is there a single surge mechanism? Contrasts in dynamics between glacier surges in Svalbard and other regions. Journal of Geophysical Research—Solid Earth 108, article no. 2237, doi: 10.1029/2002JB0011906.
[Crossref]
Nuttall
A.-M.,
Hagen
J.O.
&
Dowdeswell
J. 1997.
Quiescent-phase changes in velocity and geometry of Finsterwalderbreen, a surge-type glacier in Svalbard. Annals of Glaciology 24,
249–254.
Pillewizer
W. 1939.
Die Kartographischen und Gletcherkundlichen Ergenbnisse der Deutchen Spitsbergen Expedition 1938. (The cartographic and glacier related results of the German Spitsbergen Expedition, 1938.) Petermanns Geographische Mitteilungen, Ergãnzungsband 238,
36–38.
Pillewizer
W.
&
Voigt
U. 1968. Block movement of glaciers. Geodätische und Geophysikalische Veröffentlichungen 3(9). Berlin: National Committee on Geodesy and Geophysics of the German Democratic Republic.
Sund
M.
&
Eiken
T. 2004.
Quiescent-phase dynamics and surge history of a polythermal glacier: Hessbreen, Svalbard. Journal of Glaciology 50,
547–555.
[Crossref]
Sund
M.
&
Eiken
T. 2010.
Recent surges on Blomstrandbreen, Comfortlessbreen and Nathorstbreen, Svalbard. Journal of Glaciology 56,
182–184.
[Crossref]
Sund
M.,
Eiken
T.,
Hagen
J.O.
&
Kääb
A. 2009.
Svalbard surge dynamics derived from geometric changes. Annals of Glaciology 50,
50–60.
[Crossref]
Voigt
U. 1966.
The determination of the direction of movement on glacier surfaces by terrestrial photogrammetry. Journal of Glaciology 6,
359–367.
Wiesel
J. 1985.
Digital image processing for othophoto generation. Photogrammetria 40,
69–76.
[Crossref]
Zagrajski
S.
&
Zawadzki
A.
1936. Polska wyprawa na Spitsbergen 1934. Praca geodezyjne i kartograficzne. (Polish expedition to Spitsbergen 1934. Geodetic and cartographic work.) Warszaw: Military Institute of Geography.