RESEARCH/REVIEW ARTICLE
The intraseasonal variability of winter semester surface air temperature in Antarctica
Lejiang Yu,1,2 Zhanhai Zhang,2 Mingyu Zhou,2,5 Shiyuan Zhong,3 Bo Sun,2 Hsiaoming Hsu,4 Zhiqiu Gao,5 Huiding Wu2 & Junmei Ban4
1Applied Hydrometeorological Research Institute, Nanjing University of Information Science & Technology, 219 Ningliu Road, Nanjing, 210044 Jiangsu, People's Republic of China
2Polar Research Institute of China, 451 Jinqiao Road, Pu Dong, 200136 Shanghai, People's Republic of China
3Michigan State University, 208 Geography Building, East Lansing, MI 48824, USA
4National Center for Atmospheric Research, PO Box 3000, Boulder, CO 80307-3000, USA
5State Key Laboratory of Atmospheric Boundary Layer Physics and Atmospheric Chemistry, Institute of Atmospheric Physics, Chinese Academy of Sciences, 100029 Beijing, People's Republic of China
Abstract
This study investigates systematically the intraseasonal variability of surface air temperature over Antarctica by applying empirical orthogonal function (EOF) analysis to the National Centers for Environmental Prediction, US Department of Energy, Reanalysis 2 data set for the period of 1979 through 2007. The results reveal the existence of two major intraseasonal oscillations of surface temperature with periods of 26–30 days and 14 days during the Antarctic winter season in the region south of 60°S. The first EOF mode shows a nearly uniform spatial pattern in Antarctica and the Southern Ocean associated with the Antarctic Oscillation. The mode-1 intraseasonal variability of the surface temperature leads that of upper atmosphere by one day with the largest correlation at 300-hPa level geopotential heights. The intraseasonal variability of the mode-1 EOF is closely related to the variations of surface net longwave radiation the total cloud cover over Antarctica. The other major EOF modes reveal the existence of eastward propagating phases over the Southern Ocean and marginal region in Antarctica. The leading two propagating modes respond to Pacific–South American modes. Meridional winds induced by the wave train from the tropics have a direct influence on the surface air temperature over the Southern Ocean and the marginal region of the Antarctic continent.
Keywords:
Antarctic climate; surface air temperature; intraseasonal variability; Antarctic Oscillation
Correspondence
Lejiang Yu, Polar Research Institute of
China, 451 Jinqiao Road, Pu Dong, 200136
Shanghai, People’s Republic of China.
Email: yulejiang@pric.gov.cn
Published: 22 February 2011
Citation: Polar Research 2011, 30, 6039, DOI: 10.3402/polar.v30i0.6039
Polar Research 2011. © 2011 L. Yu et al. This is an open-access article distributed under the terms of the Creative Commons Attribution-Noncommercial 3.0 Unported License (http://creativecommons.org/licenses/by-nc/3.0/), permitting all non-commercial use, distribution, and reproduction in any medium, provided the original work is properly cited.
Intraseasonal atmospheric oscillations occur in many regions of the world. Over the tropical region, the Madden–Julian Oscillation (MJO; Madden & Julian 1971, 1972) and sub-monthly oscillations (Krishnamurti & Bhalme 1976; Murakami 1976; Krishnamurti & Ardunay 1980; Chen & Chen 1993) are the two primary intraseasonal oscillatory modes. Because of their strong influence on Asian monsoons, these tropical intraseasonal oscillations have been studied by many investigators (Krishnamurti & Ardunay 1980; Holland 1986; Chen & Chen 1993; Wu et al. 1999; Wu & Wang 2001; Wheeler & Hendon 2004). Weickmann (1983) and Weickmann et al. (1985) initially discussed characteristics of intraseasonal oscillations over the Pan-America region and their impact within a global perspective. Some researchers also studied intraseasonal oscillations in Southern mid-latitudes (Ghil & Mo 1991; Lau et al. 1994; Mo & Higgins 1998). Although some studies have examined intraseasonal oscillations using a single's station meteorological data from Antarctica or sea-ice data in the Southern Ocean (Yasunari & Kodama 1993; Baba et al. 2006), to our knowledge there have been no systematic studies of intraseasonal variability over the entire region south of 60° S. Given the critical role that Antarctica plays in global climate change, it is important to understand the causes of the intraseasonal oscillations in this region and their impact on Antarctic weather and climate. This paper presents a systematic analysis of the intraseasonal variability of surface air temperature in the region south of 60°S and the possible reasons for the oscillation. Our results indicate that there are two primary regimes of surface temperature on intraseasonal timescales over Antarctica and its vicinity. One is the Southern Ocean next to the continent and the other is Antarctica itself. For the Southern Ocean, tropical convection has strong influences on the primary empirical orthogonal function (EOF) modes related to the Pacific–South American modes. On the other hand, the primary intraseasonal mode associated with the Antarctic Oscillation is in connection with the net upward longwave radiative fluxes and cloud cover. Before we present our analyses, we review the literature on climate variability in Antarctica and in the Southern Ocean on intraseasonal and interannual timescales.
The Antarctic continent is surrounded by the Southern Ocean, connecting the Pacific, Atlantic and Indian oceans (Fig. 1). There is a general consensus that in the Antarctic, including the Southern Ocean, the atmospheric and oceanic variables and sea-ice oscillate on a variety of timescales. Walker (1923, 1924) was the first to discover the relationships between the limit of the Antarctic sea ice and variations in sea-level pressure, storm tracks and the Southern Oscillation Index (SOI). Later, Karoly (1989) analysed South Pacific upper-air fields and showed that a wave train appeared during the austral winter in “warm” El Niño–Southern Oscillation (ENSO) events, which became known as the Pacific–South American (PSA) connection. This wave train influences the synoptic conditions across the Antarctic Peninsula (Harangozo 2000). Simmonds & Jacka (1995) found strong relationships between ice extent in the south-east Indian Ocean in April–October and the SOI of the previous 12 months. Yuan (2004) suggested a synthesized ENSO-related impact on Antarctic sea ice and found two main mechanisms responsible for the formation/maintenance of the Antarctic Dipole. These are the heat flux due to the mean meridional circulation of the regional Ferrel Cell and the regional anomalous circulation generated by stationary eddies. Turner (2004) reviewed the effects of the ENSO over the Antarctic continent.
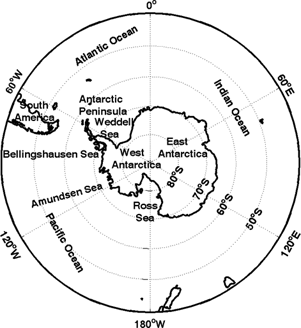
Fig. 1.
of the Antarctic continent and Southern Ocean.
The dominant mode of low-frequency variability in the Southern Hemisphere has a zonally symmetric structure referred to as the Antarctic Oscillation (AAO) or the Southern Annular Mode (SAM; Gong & Wang 1999; Thompson & Wallace 2000). In addition, the AAO has significant power in its eddy structure (King et al. 2004; Simmonds & King 2004). The mode shows a phase reversal between anomalies in the Southern Hemisphere's high and mid-latitudes characterized by an equivalent barotropic pattern, with the maximum amplitude of variation in the upper troposphere (Kidson 1988a). It is associated with a meridional seesaw variation of the zonal wind anomalies between around 40°S and 60°S (Kidson 1988b). The SAM has most of its variance concentrated in the low-frequency range, at periods greater than about 50 days (Hartmann & Lo 1998). Hall & Visbeck (2002) considered that the annular mode influences not only the extratropical atmospheric circulation but also the variations of the underlying oceans and sea-ice concentration.
Many studies have shown that the development, maintenance and variation of the annular mode can not depend on zonally asymmetric features of the lower boundary forcing and detailed physical processes but are driven by the eddy-zonal flow interactions (Robinson 1991, 1996, 2000; Watterson 2002; Rashid & Simmonds 2004). In addition, the SAM is also influenced strongly by external forcings such as stratospheric ozone depletion and increased atmospheric greenhouse gas (Thompson & Solomon 2002; Arblaster & Meehl 2006). The ENSO teleconnection to the high-latitude South Pacific is governed by the coupled relationship between the PSA pattern associated with ENSO and SAM (Fogt & Bromwich 2006).
The Antarctic Circumpolar Wave (ACW) was characterized as eastward propagating wavenumber-2 anomalies in sea-level pressure, wind stress, sea surface temperature and sea-ice extent over the Southern Ocean. It took 8–10 years to encircle the pole with a period of 4–5 years (Jacobs & Mitchell 1996; White & Peterson 1996). Cai & Baines (2001) and Venegas (2003) found that zonal wavenumber 3 has substantial variability over longer observational periods in addition to zonal wavenumber 2. The existence of ACW has also been supported by a number of modelling studies (Christoph et al. 1998; Bonekamp et al. 1999; Cai et al. 1999; Weisse et al. 1999). The ACW and ENSO are found to be regulated by each other (Cai & Baines 2001; Carril & Navarra 2001; Venegas 2003; White & Annis 2004; Aiken et al. 2006). Tropospheric response to ACW occurs along the sea-ice edge around Antarctica (White et al. 2004). The response to ACW also exists along the mid-latitude storm track near 40°S (White & Simmonds 2006).
The Semi-annual Oscillation (SAO) is another component of the intricate multimedia interactions over the Southern Ocean. Walland & Simmonds (1999) described in detail the phenomenon that the seasonal cycle of the zonally averaged climatological surface pressure exhibits a strong semi-annual component in the circumpolar trough, which extend over Antarctic latitudes with a node at about 55°S. Van Loon (1967) suggested an explanation that the SAO results from the different annual cycles of the temperature over the Antarctic continent and the mid-latitude oceans and considered its influence on the meridional temperature gradient in the southern high latitudes. The SAO has been found to influence physical and biological processes in the Southern Ocean and their seasonal, interannual and decadal variations (Enomoto & Ohmura 1990; Stammerjohn & Smith 1996; Harangozo 1997; Simmonds & Jones 1998; Burnett & McNicoll 2000; Simmonds 2003).
Earlier work on Antarctic intraseasonal variability
Intraseasonal variability over the Antarctic continent has been revealed by research taking place during the last two decades. Lu et al. (1989) studied the spectrum of surface atmospheric variables at China's Great Wall Station (62.2°S, 59.0°W) from 1985 through 1987 and found a structure propagating eastwards with periods of one or two weeks. Yasunari & Kodama (1993) also revealed an intraseasonal variability (30- to 50-day period) of surface air temperature and katabatic wind at Japan's Mizuho Station, which were linked to the modulation of planetary flow regime and meridional circulation in the southern middle and high latitudes. Lu et al. (1996) conducted a preliminary analysis of the characteristics of atmospheric oscillation during the 1993 Antarctic ozone hole, and showed quasi-one-week and quasi-two-week oscillations in total ozone, pressure and temperature with the same phase. Hsu & Weng (2002) found an eastward propagating circulation pattern in the stratosphere of the Southern Hemisphere with a period of 30 days; this was named the Stratospheric Antarctic Intraseasonal Oscillation (SAIO). It exhibits a wavenumber-1 structure, characterized by a deep vertical structure extending from the upper troposphere to the upper stratosphere with the amplitude increasing rapidly with the height up to 5 hPa.
Intraseasonal variability can also be found in the Southern Ocean, where it is usually associated with the AAO and tropical convection. Large-scale sea-level variations appeared around Antarctica for periods varying from 10 to 100 days, which had significant negative correlations with the AAO (Aoki 2002). A wavenumber-2 eastward propagating wave with a period of 10–15 days appeared in the atmospheric and sea-ice fields around the Antarctic marginal ice zone in austral winter (Baba & Wakatsuchi 2001). Matthews & Meredith (2004) found that the variability of oceanic Antarctic circumpolar transport and the atmospheric SAM on intraseasonal (30–70-day) timescales was related to the tropical atmospheric MJO during the southern winter. By means of complex empirical orthogonal functions (CEOFs), Baba et al. (2006) reported that the largest amplitudes in variability along the marginal sea-ice zone occurred around West Antarctica, especially in the Amundsen and Bellingshausen seas, and that the spatial phase of the meridional wind velocity preceded that of sea-ice concentration by about 90°. Lima & Carvalho (2008) demonstrated the relationship between mid-latitude atmospheric wave train and sea-ice area in the Amundsen and Bellingshausen seas and showed that the extreme sea-ice area anomalies on intraseasonal timescales (20–100 days) lag behind the propagation of subtropical wave train in the Southern Hemisphere by approximately 10–15 days.
It is well known that besides the AAO (SAM), the main low-frequency modes in the Southern Hemisphere are PSA (PSA1 and PSA2) modes with a zonal wavenumber-3 pattern (Farrara et al. 1989; Ghil & Mo 1991; Kidson 1991; Lau et al. 1994; Mo & Higgins 1998; Kiladis & Mo 1999). Mo & Higgins (1998) related the PSA to tropical convection and outgoing longwave radiation (OLR). The intraseasonal variation in tropics and subtropics is associated with atmospheric and oceanic variability in the Southern Ocean (Matthews & Meredith 2004; Lima & Carvalho 2008).
It is not clear whether the intraseasonal variability over the Antarctic continent originates from the tropical and subtropical intraseasonal variability or from Antarctic intrinsic atmospheric oscillation on intraseasonal timescales. In this study, we investigate intraseasonal variability (10–90 days) of 2-m air temperature southward of 60°S, where the main variation is observed. We also examine the physical mechanisms for this variability. Our analyses focused on the winter season (April–September), when a strong signal of intraseasonal variability occurs.
Below, we first describe the data and analysis methods that were used in this study. This is followed by a presentation of the results of EOF for different atmospheric variables. We then discuss plausible interpretations for various EOF modes. The final section summarizes our findings and offers conclusions.
Data and methodology
Data
This study makes use of one of the global reanalysis data sets produced by the National Centers for Environmental Predictions (NCEP) and the National Center for Atmospheric Research (NCAR), USA. The reanalyses are long-term, dynamically consistent gridded global meteorological and hydrological data sets. The original NCEP/NCAR reanalysis data set (hereafter NCEP1) was produced using a global data assimilation system with inputs from NCEP's operational global spectral model that has a horizontal resolution of T62 (ca. 209 km), and various observations from multiple sources including surface, upper-air, satellites and aircrafts. The archived data contain a large set of atmospheric and hydrological variables on a 2.5°×2.5° longitude–latitude grid and 28 vertical levels with a temporal resolution of six hours from 1948 to the present. A detailed description of the NCEP/NCAR global reanalysis data can be found in Kalnay et al. (1996) and Kistler et al. (2001).
The current study uses an improved version of the NCEP/NCAR global reanalysis data: the NCEP–Department of Energy (DOE) Reanalysis 2 data set (hereafter referred to as NCEP2). The NCEP2 fixed errors and updated parameterizations of physical processes in NCEP1 and, therefore, is believed to be superior to its predecessor (Kanamitsu et al. 2002). Specifically, NECP2 fixed errors in the snow cover in NCEP1 for the entire 1974–1994 period (Kanamitsu et al. 2002). The problem associated with the misplacement of the Australian Surface Pressure Bogus Data between 1979 and 1992 has been fixed. Using long-term (1979–2001) surface and upper-air data from 10 coastal stations in Antarctica, Yu et al. (2009) showed that the wintertime surface temperature in NCEP2 is in good agreement with the observed temperature on intraseasonal and interannual timescales. The correlations between NCEP2 and observations in Table 1 also show that NCEP2 describes well surface air temperature in the austral winter semester since 1979. Bromwich et al. (2007) assessed the performance of several global reanalyses data sets, including NCEP, ERA-40 and JRA-25, in the polar regions and found that the differences in the circulation and cyclonic activities between these reanalyses data sets occurred primarily before 1979. Hence, only data after 1979 in NCEP2 are used to analyse the Antarctic intraseasonal variability. More validations of NCEP2 are being performed using wintertime daily surface observational data from the British Antarctic Survey's Reference Antarctic Data for Environmental Research project (Turner et al. 2004).
Table 1. Correlation coefficients of the time series of 2-m air temperature (April–September) during different periods for daily Reanalysis 2 data and observations from the US National Centers for Environmental Prediction.
| Station |
Location |
Period |
Days |
Correlation coefficients |
| Amundsen–Scott |
90°S |
1979–2006 |
5124 |
0.603 |
| Bellingshausen |
62.2°S, 58.9°W |
1979–2006 |
5124 |
0.732 |
| Casey |
66.3°S, 110.5°E |
1979–2005 |
4941 |
0.692 |
| Davis |
68.6°S, 78.0°E |
1979–2005 |
4941 |
0.681 |
| Dumont d'Urville |
66.7°S, 140.0°E |
1979–2001 |
4209 |
0.681 |
| Faraday |
65.4°S, 64.4°W |
1979–2006 |
5124 |
0.574 |
| Ferraz |
62.1°S, 58.4°W |
1992–2005 (no 2000) |
2379 |
0.757 |
| Great Wall |
62.2°S, 59.0°W |
1985–2005 |
3843 |
0.751 |
| Halley |
75.5°S, 26.4°W |
1979–2006 |
5124 |
0.511 |
| Macquarie |
54.5°S, 158.9°E |
1979–2000 |
4026 |
0.562 |
| Mawson |
67.6°S, 62.9°E |
1979–2005 |
4941 |
0.726 |
| Mirny |
66.5°S, 93.0°E |
1979–2006 |
5124 |
0.710 |
| Molodeznaja |
67.7°S, 45.9°E |
1979–1998 |
3660 |
0.672 |
| Neumayer |
70.7°S, 8.4°W |
1981–2006 |
4758 |
0.613 |
| Novolazarevskaja |
70.8°S, 11.8°E |
1979–2006 |
5124 |
0.613 |
| Rothera |
67.5°S, 68.1°W |
1979–2005 |
4941 |
0.600 |
| Syowa |
69.0°S, 39.6°E |
1979–2004 (no 1999) |
4758 |
0.625 |
| Vostok |
78.5°S, 106.9°E |
1979–2006 (no 1994, 1996, 2003) |
4575 |
0.46 |
| Zhongshan |
69.4°S, 76.4°E |
1989–2005 |
3111 |
0.620 |
|
The primary variables from the archived NCEP2 data set used in the current analyses include daily values of 2-m air temperature, geopotential heights and zonal wind at various pressure levels (10–850 hPa), 200-hPa streamfunctions and velocity potential, 10-m winds, surface longwave radiative fluxes and total cloud cover. Interpolated OLR data are from the National Oceanic and Atmospheric Administration (NOAA), USA (Liebmann & Smith 1996).
Methodology
The focus of the study is on the variability of surface air temperature over Antarctica and the Southern Ocean on an intraseasonal timescale and the potential mechanisms responsible for the variability. Several analysis methods are used. The primary method is to perform EOF analysis on daily mean variables at grid points in the region southward of 60°S during the austral winter semester (April–September) over the 29-year period (1979–2007). The method of EOF was put forward by Pearson (1902), with the purpose of reducing a large number of variables to a few variables without compromising much of the explained variance. The EOF method has been widely used to detect valuable climatic signals (North et al. 1995) as well as to extract individual modes of variability such as the Arctic Oscillation (Thompson & Wallace 1998).
To emphasize intraseasonal variability, a 10–90-day band-pass filter (Butterworth filter) is first applied to the data. This filters out the variability with periods less than 10 days that is typically related to diurnal or synoptic-scale processes, and variability with periods greater than 90 days that are associated with changes in seasonal or interannual forcing. Another method to help identify the intraseasonal variation is to apply wavelet analysis to the data. In addition, composite analysis is performed to link the intraseasonal variability over Antarctica to similar variability over tropics.
Leading EOF modes
The spatial distributions of the leading four EOF modes of 10–90-day band-pass filtered 2-m air temperature south of 60°S are shown in Fig. 2. The first mode accounts for 23.7% of the total variance of the intraseasonal variation. Except for a small region near 60°S between 140°W and 150°E, the values of the first mode are positive with maximum values representing the greatest intraseasonal variability occurring over the Ross Sea and the Amundsen Sea and a small part of the interior continent (Fig. 2a). The spatial pattern of the first mode does not display a zonal wave train. The second, third and fourth modes explain 10.8%, 6.7% and 5.5% of the total variance. According to the estimation of sampling errors (North et al. 1982), the third and fourth modes are valuable signals. Their spatial patterns exhibit wave characteristics with zonal wavenumbers 1, 2 and 1, respectively. The centres of large variations of the second and third modes appear over the Ross Sea, the Amundsen Sea, the Bellingshausen Sea and the Weddell Sea. The smaller variations exist over East Antarctica. The negative (positive) centre of the fourth mode occurs over East (West) Antarctica.
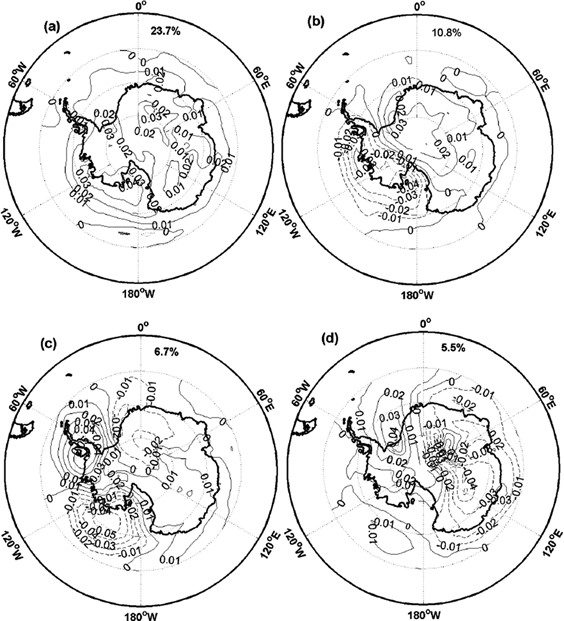
Fig. 2.
Spatial distributions of the leading four empirical orthogonal function modes of 2-m air temperature: (a) first mode, (b) second mode, (c) third mode and (d) fourth mode.
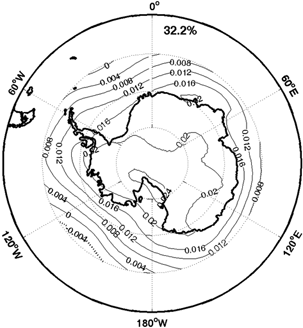
Fig. 3.
Spatial distributions of the first empirical orthogonal function mode of band-pass filtered surface pressure.
In order to more clearly identify the wave structures of the four modes, we remove the zonal mean prior to applying EOF analysis (not shown). The leading three modes removed the zonal mean correspond to modes 2–4 in Fig. 2 with high spatial correlation coefficients of 0.87, 0.99 and–0.88, respectively. The spatial pattern of the fourth mode after removing zonal mean also shows a wavenumber-3 structure. The differences between EOF analyses with and without zonal mean indicate that the first mode of 10–90-day band-pass filtered 2-m temperature is not characterized by wave propagating structure, while modes 2–4 are likely to be associated with planetary waves.
The time coefficients of the leading four EOF modes of 10–90-day band-pass filtered surface air temperature, without removing the zonal mean, are spectrally analysed to identify the dominant spectral structures. Their dominant periods are 26–30 days and 13–14 days. These same two periods also exist in the time series of the AAO, PSA1 and PSA2. Similar periods of these oscillations have also been identified in the power density of the daily surface pressure and air temperature when applying the spectral analysis to station observations (Zhou et al. 2009), suggesting that the intraseasonal oscillations identified in the reanalysis data are not an artefact of reanalysis procedures but are true physical signals.
Proposed explanations for the leading EOF modes
The first mode
To examine the relationship between the surface temperature variation and the variations of other surface variables, similar EOF analysis with 10–90-day band-pass filter was applied to surface pressure and the spatial distribution of its first mode is shown in Fig. 3. The spatial pattern of surface pressure is similar to that of the surface air temperature, with all of the values positive except for a small area (near 60°S, 160°W–110°W), and maxima over the Ross Sea. The decorrelation time computed from the time-lagged autocorrelation is about 10 days. Assuming 18 degrees of freedom per Antarctic winter, the correlation should be larger than 0.08 to be statistically significant at the 95% confidence interval. The correlation coefficient between the time coefficients of the first mode for surface air temperature and surface pressure is 0.32 at the 95% confidence level. The significantly positive correlation indicates that on an intraseasonal timescale in the austral winter an increase in surface pressure over Antarctica is typically associated with rising surface air temperature and vice versa.
To verify the relationship between the leading three modes and the AAO, PSA1 and PSA2, EOF analysis of daily 700-hPa geopotential height is made from 1979 to 2007 during the winter season (not shown). The three leading modes correspond to the AAO, the PSA1 and the PSA2 (Mo & Paegle 2001). The first mode is negatively correlated (correlation coefficient–0.20) with the AAO. It shows that the positive AAO index is associated with negative anomaly of surface air temperature as a result of adiabatic cooling (Thompson & Wallace 2000). The second mode has a closer relationship with the PSA2 (correlation coefficient–0.14 at the >99.9% confidence level) compared to the PSA1. However, the third mode is more consistent with the PSA1 (correlation coefficient–0.27 at the >99.9% confidence level) than it is with the PSA2. The further explanation of the relationship between the second and third modes and the PSA1 and PSA2 can be seen in the next section.
Because the first mode is related to the AAO and the barotropic structure of the AAO, the first mode of surface air temperature may be closely coupled to the pressure and wind field in the middle to upper troposphere and lower stratosphere. The relationship between surface air temperature and atmospheric pressure aloft are investigated by applying the 10–90-day band-pass filtered EOF analysis to the geopotential heights at 15 selected pressure levels (10, 20, 30, 50, 70, 100, 150, 200, 250, 300, 400, 500, 600, 700, 850 hPa). The time coefficients of mode 1 of the geopotential heights at various levels are correlated well with those of mode 1 of surface air temperature. The correlation coefficients are higher than 0.6 from 600 hPa up to 100 hPa, with a peak value of ca. 0.7 around 300 hPa and 400 hPa. The correlations drop gradually below 600 hPa, but very rapidly above 100 hPa. Owing to the impact of synoptic activity at the surface and in the mid-troposphere (Keable et al. 2002; Simmonds et al. 2003), the maximum correlation coefficient does not exist at the surface. On the contrary, the largest correlation (correlation coefficients–0.40) between the first mode of temperature and zonal wind occurs at the 150-hPa level. The spatial pattern of the first mode of zonal wind is shown in Fig. 4b. While the surface air temperature is a negative anomaly in the intraseasonal variability, the zonal wind and Antarctic polar vortex in the lower stratosphere strengthens. Because of barotropic effect of the AAO, the stronger polar vortex helps the lower pressure in the stratosphere and troposphere.
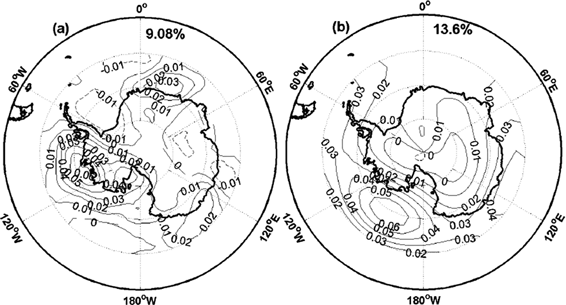
Fig. 4.
Spatial distribution of the first mode for (a) upward net longwave radiation flux and (b) 150-hPa zonal wind.
Whether the intraseasonal variation of the upper atmosphere exerts an impact on surface air temperature or not needs to be solved. Time delay estimation based on the conventional bispectrum method is made, for the method can depress Gaussian interferences compared with cross-correlation method (Nikias & Raghuveer 1987). The result of time delay estimation is that the variance of surface air temperature leads that of 300-hPa geopotential height by one day. It indicates that the intraseasonal variation of the upper atmosphere derives from surface air temperature. Basing their work on results from two sensitivity studies, Simmonds & Law (1995) found that the boundary forcing (topography) has significant effects on the thermal structure of the atmosphere and the upper-level vortex.
During the austral winter, radiative balance is determined by net longwave radiative fluxes (upward minus downward) because of no shortwave radiation (Zhang et al. 2007). To determine the relationship between surface air temperature and net longwave radiative fluxes we have calculated 10–90-day band-pass filtered EOF of the net longwave radiative fluxes and the results are shown in Fig. 4a. The time coefficients of the mode-1 surface temperature are closely correlated (correlation coefficients–0.68) with that of the net longwave radiative flux. Likewise the time coefficients of the mode-1 net longwave radiation are closely correlated with these of 300-hPa geopotential height and 150-hPa zonal wind, with correlation coefficients of–0.41 and 0.42, respectively. These correlations show that a large amount of heat radiated upwards leads to a decrease in surface air temperature, lowers upper geopotential height and strengthens zonal wind and Antarctic polar vortex. The result agrees with the conclusion of Francis & Salby (2001), who considered that radiation strongly influences the Antarctic polar-night vortex. Ambach (1974) found that cloud cover can increase downward longwave radiation and surface air temperature. The time coefficients of the mode-1 cloud cover are closely correlated with these of net longwave radiative fluxes and surface air temperature, with correlation coefficients of–0.59 and 0.55, respectively. This indicates that total cloud cover plays an important role in the intraseasonal variability in the troposphere and lower stratosphere during the austral winter.
Hsu & Weng (2002) found the SAIO above 100-hPa level, with the largest amplitude at about the 5-hPa level. The 30-day period they found is similar to our results. But our results demonstrate that the correlation between surface forcing and upper-level geopotential height variation decreases rapidly above 100 hPa (Fig. 4): it is unlikely that the oscillation at the 5-hPa level is related to surface forcing. The SAIO may come from solar activity (Cebula & Deland 1998).
Using observations from a single station (Mizuho Station) in East Antarctica, Yasunari & Kodama (1993) also found intraseasonal variabilities of surface air temperature and katabatic winds, attributing them to the variations of large-scale upper-level circulations. Our calculation shows that the time series of the mode-1 surface air temperature leads that of 300-hPa geopotential height. However, changes in large-scale upper-air circulation may also alter surface and lower tropospheric conditions (Thompson & Solomon 2002; Grise & Thompson 2009).
The 10–90-day intraseasonal variation of main propagating modes
Two dominant periods suggest that different mechanisms may be at play in producing these intraseasonal oscillations. Here we focus mainly on the 26–30-day period intraseasonal oscillation. A similar method can also be applied to understand the mechanism for the 14-day period of oscillation.
We use the 20–90-day band-pass filtered 200-hPa streamfunction to represent circulation anomalies and applied EOF analysis to it. The zonal mean is removed to obtain eddy streamfunction. The first four EOFs explain 22.5%, 15.8%, 13.8% and 9.5% of the total variance. The first two EOF modes (Fig. 5a, b) are in quadrature, consistent with oscillatory behaviour. Both patterns have wavenumber 1 over the Southern Ocean with large amplitudes in the Pacific–South American sector. The third and fourth modes are also in quadrature with wavenumber 2 over the Southern Ocean. Figure 6 shows the lagged correlations between time coefficients of mode 1 and mode 2 and between time coefficients of mode 3 and mode 4. Two pairs of time coefficients are significantly positively correlated from lag 2-day to lag 11-day with the maximum lag correlation at 6–7 days. The 26–30-day period we have obtained by wavelet analysis is similar to the fourfold of lag time with maximum lag correlation. Here we mainly analyse the effects of mode 1 and mode 2 of the 200 hPa streamfunction on 2-m air temperature using composite analysis. The effects of mode 3 and mode 4 can be analysed with a similar method.
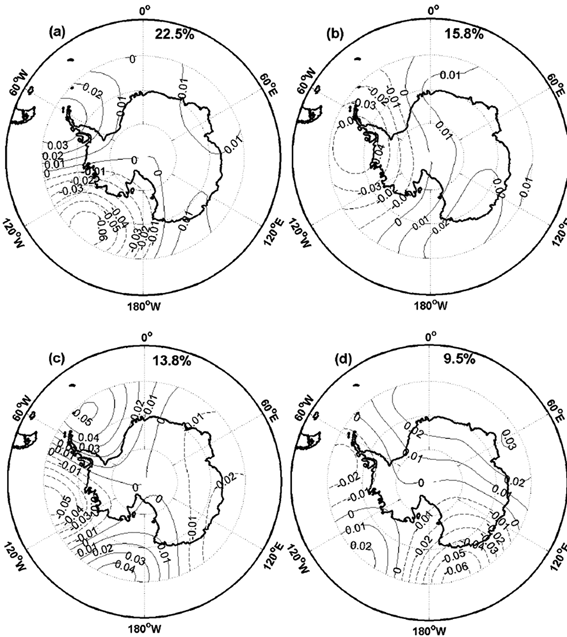
Fig. 5.
Spatial distributions of the leading four empirical orthogonal function modes for 20–90-day band-pass filtered 200-hPa streamfunction: (a) first mode, (b) second mode, (c) third mode and (d) fourth mode.
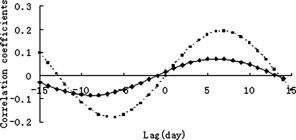
Fig. 6.
Correlations as a function of lead and lag time between time coefficients of mode 1 and mode 2 (dotted line with square markers) and between time coefficients of mode 3 and mode 4 (solid line with diamond markers).
In this paper, we focus on strong persistent events in the austral winter semester from 1979 to 2007. By compositing these strong events during different phases, the reason for the propagating modes can be found. The composite criterion is as follows: a positive (negative) mode-1 or mode-2 event is identified when the corresponding time coefficient is greater (less) than 1.2 standard deviations for at least six days (Mo & Higgins 1998). There are 22 positive and 20 negative mode-1 events with an average duration of 9.3 days. Eighteen positive and 19 negative mode-2 events have an average duration of 8.6 days. Composites of 200-hPa eddy streamfunction anomalies and OLR anomalies for positive and negative mode-1 and mode-2 events are produced by averaging over the duration of each event and by averaging all events in the same category. Each event is considered as one degree of freedom. Areas where values are statistically significant at the 95% confidence level are shaded in Figs. 7 and 8. Figure 7 shows the evolution of the composite mean 200-hPa eddy streamfunction anomalies. The evolution of the two modes is summed up as follows:

After the flow leaves a mode, the path described above is the most likely path for the flow to take, but sometimes the next mode may not be one of the above modes. In many cases, the flow pattern develops from one mode to another, remains stationary for some time and then propagates eastward again.
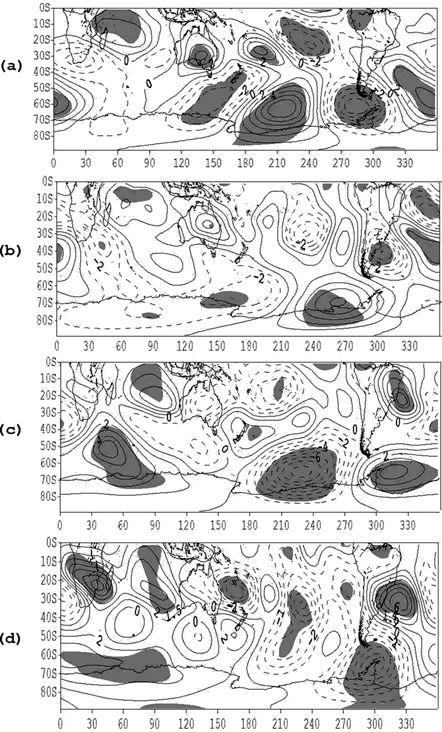
Fig. 7.
The 200-hPa 20–90-day band-pass filtered eddy streamfunction anomaly composite averaged over all (a) negative mode 1, (b) negative mode 2, (c) positive mode 1 and (d) positive mode 2. Contour interval is 1×10⁶ m2 s−1. Regions with values that are statistically significant at the 95% confidence level are shaded.
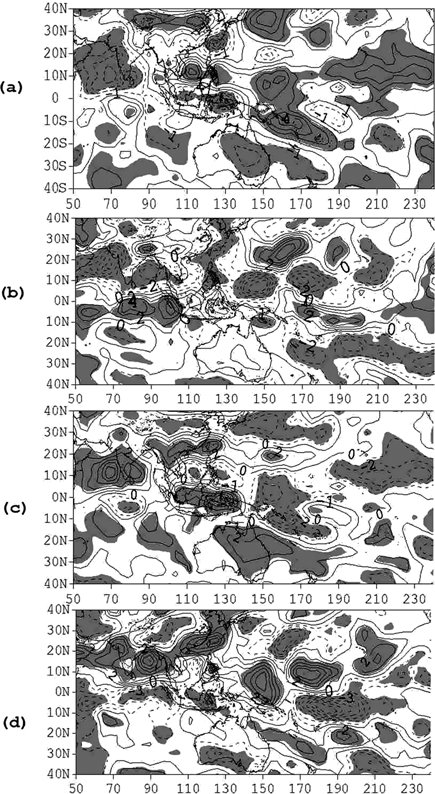
Fig. 8.
The 20–90-day band-pass filtered outgoing longwave radiation anomaly composite averaged over all (a) negative mode 1, (b) negative mode 2, (c) positive mode 1 and (d) positive mode 2. Contour interval is 1 W m−2. Regions with values that are statistically significant at the 95% confidence level are shaded.
Although in mid-latitudes the four modes display zonal wavenumber-3 structure, except for negative mode 1, the other three modes at high latitudes exhibit zonal wavenumber-1 structure that is similar to the spatial pattern in Fig. 5a, b. For negative mode 1 (Fig. 8a), a positive anomaly occurs over the Indian Ocean, with a wave train propagating south-eastward. Negative anomalies exist over the ocean south of Australia, the southern Indian Ocean and the Antarctic Peninsula, while positive anomalies occur over the Ross Sea and the Atlantic sector of the Southern Ocean. The most anomalous patterns propagate eastward over the Southern Ocean. The spatial pattern in negative mode 1 is similar to PSA mode, which Mo & Higgins (1998) associate with tropical convection. It is clear from the above discussions that the tropical intraseasonal variations have an impact on intraseasonal variability over the Southern Ocean and Antarctic marginal region but not the interior Antarctic continent.
Figure 8 shows the evolution of the composite mean OLR anomaly. The convection pattern associated with negative mode 1 shows enhanced convection over the Indian Ocean and the Indonesian Archipelago and suppressed convection in the western and central Pacific and the South China Sea. There is also an enhanced Walker circulation in the Pacific Ocean. With the evolution of the phase, the negative anomaly propagates eastward to the central Pacific. The spatial patterns of the first and second modes of OLR anomaly EOF bear a resemblance to the negative mode-2 and mode-1 composite OLR anomaly, respectively. The time coefficient of OLR anomaly mode 1 leads that of streamfunction mode 2 by two days (minimum correlation coefficient–0.27), and OLR anomaly mode 2 leads streamfunction mode 1 by three days (minimum correlation coefficient–0.23); both correlation coefficients are above the 95% confidence level. The composite of 200-hPa velocity potential for different phases also reflects the evolution shown in Fig. 9.
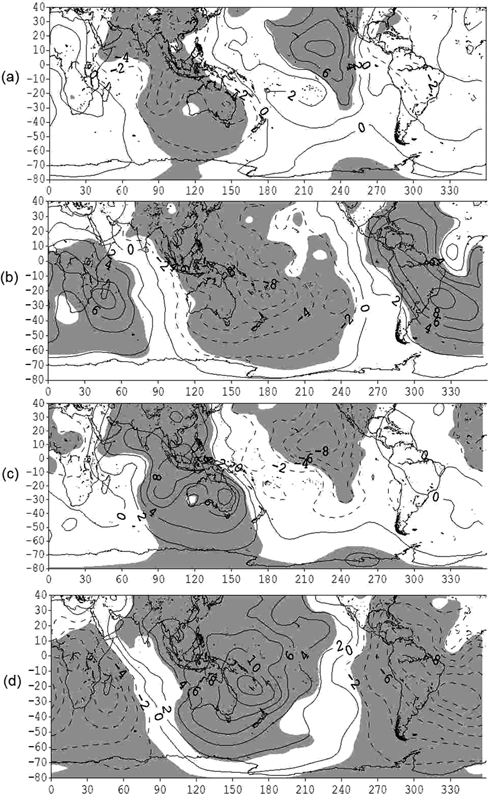
Fig. 9.
The 20–90-day band-pass filtered velocity potential anomaly composite averaged over all (a) negative mode 1, (b) negative mode 2, (c) positive mode 1 and (d) positive mode 2. Contour interval is 2×10⁵ m2 s−1. Regions with values that are statistically significant at the 95% confidence level are shaded.
To understand how 200-hPa streamfunction affects surface temperature in Antarctica on intraseasonal timescales, we show in Figs. 10, 11 and 12 the spatial patterns of 500-hPa geopotential heights, 10-m winds and surface air temperatures, respectively, in the region between 60°S and 90°S corresponding to the different phases in the composite mean 200-hPa eddy streamfunction anomalies shown in Fig. 7. The negative (positive) 200-hPa streamfunction occurs over the Antarctic Peninsula and East Antarctica (Ross Sea) at negative mode-1 phase Fig. 7a); at the same phase and place, high (low) pressure centres appear at 500-hPa level Fig. 10a). The high (low) pressure centres also appear in the sea-level pressure (not shown). The anomalies of the pressure aloft lead to wind vector and surface air temperature anomalies Figs. 11a, 12a). Over the Bellingshausen and Amundsen seas (Weddell and eastern Ross seas), southerly (northerly) anomalies are found. It is known that negative (positive) 2-m air temperature anomalies usually correspond to southerly (northerly) anomalies in the Southern Hemispheric over mid- and high-latitudes; hence, there are negative (positive) anomalies over the Bellingshausen and Amundsen seas (Weddell and eastern Ross seas). In other words, the meridional components of the 10-m winds consistently correspond to 2-m temperature anomalies.
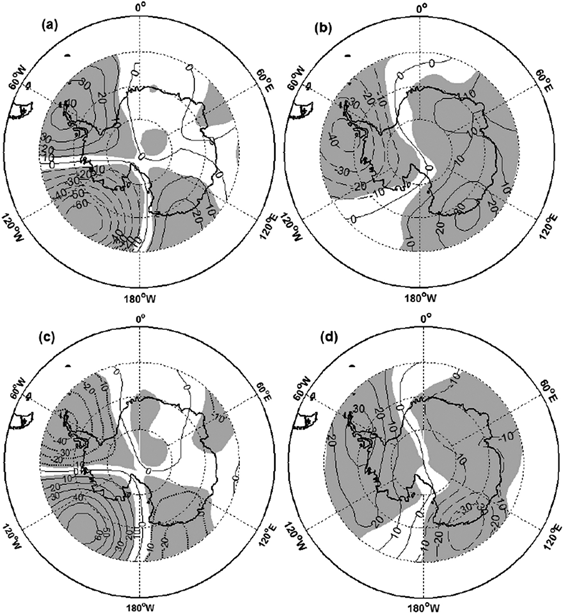
Fig. 10.
The 500-hpa 20–90-day band-pass filtered geopotential height anomaly composite averaged over all (a) negative mode 1, (b) negative mode 2, (c) positive mode 1 and (d) positive mode 2. Contour interval is 10 gpm. Regions with values that are statistically significant at the 95% confidence level are shaded.
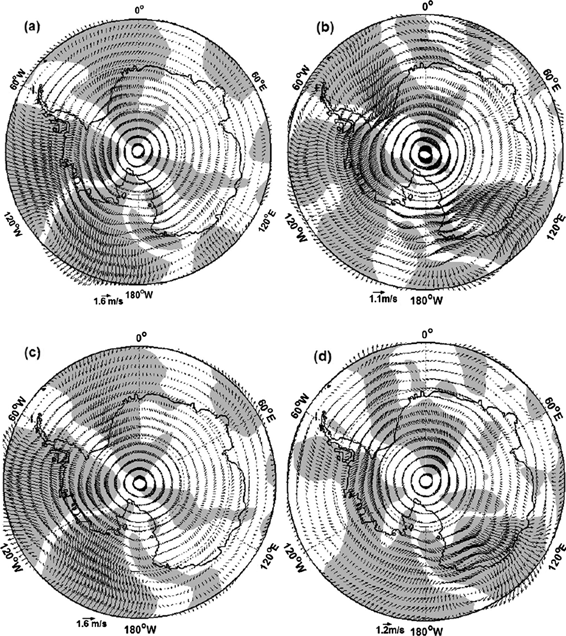
Fig. 11.
500-hpa 20–90-day band-pass filtered 10-m wind field anomaly composite averaged over all (a) negative mode 1, (b) negative mode 2, (c) positive mode 1 and (d) positive mode 2. Regions with values that are statistically significant at the 95% confidence level are shaded.
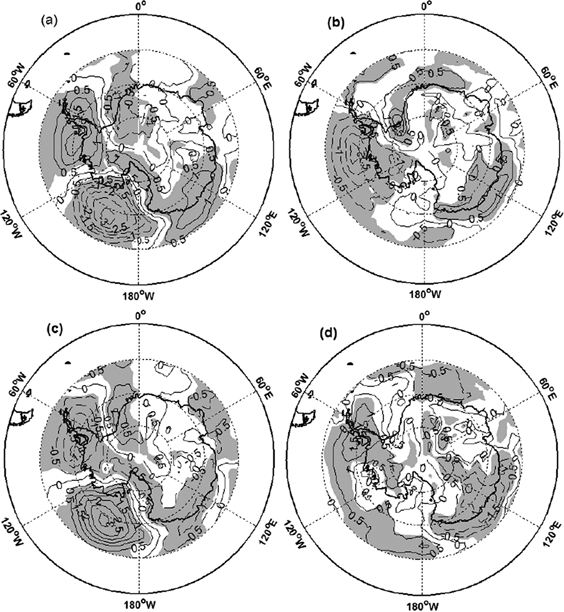
Fig. 12.
The 500-hpa 20–90-day band-pass filtered 2-m air temperature anomaly composite averaged over all (a) negative mode 1, (b) negative mode 2, (c) positive mode 1 and (d) positive mode 2. Contour interval is 0.5 °C. Regions with values that are statistically significant at the 95% confidence level are shaded.
The evolution of two modes from the negative mode 1, through the negative mode 2, the positive mode 1 and the positive mode 2, then to the negative mode 1 again occurs in all the anomalies of 500-hPa geopotential height, 10-m wind vector and surface air temperature. Those anomalies consistently propagate eastward correspondingly with the evolution of the modes. The wind vector anomaly also influences the sea-ice anomaly (Baba et al. 2006; Lima & Carvalho 2008). In most cases the effect is confined to the Southern Ocean and Antarctic marginal sea regions. In the interior of the Antarctic continent the intraseasonal surface temperature variation is primarily affected by skin temperature and total cloud cover.
The spatial patterns of the four leading EOF modes for 10–20-day band-pass filtered 200-hPa streamfunction are shown in Fig. 13. A similar method can be applied to the analysis of 10–20-day intraseasonal variation with propagating characteristics. Corresponding tropical convection patterns can also be found. Further, the effects of the meridional wind on surface air temperature are similar to the above analysis. These analyses are not repeated here.
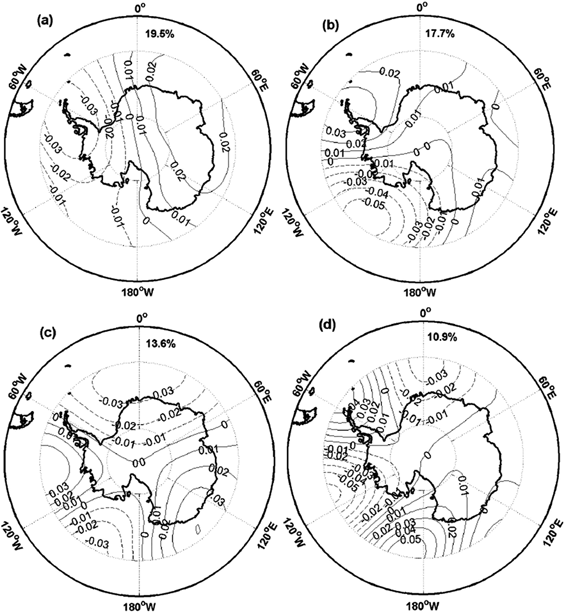
Fig. 13.
Spatial distributions of the leading four empirical orthogonal function modes for 10–20-day band-pass filtered 200-hPa streamfunction with the zonal mean removed.
Conclusions
In this study, intraseasonal variability of 2-m surface air temperature in Antarctica and the Southern Ocean during the austral winter was investigated using the 29-year (1979–2007) NCEP-DOE global reanalysis data set. The EOF analyses with three band-pass (10–90-day, 20–90-day and 10–20-day) filters were applied to the normalized variances of surface air temperature. The analysis identified two distinct periods (26–30 days and 13–14 days) of intraseasonal oscillations during the austral winter in the region south of 60°S.
The AAO is found to be primarily responsible for the first mode of surface air temperature that shows a nearly uniform spatial pattern over Antarctica. Because of the barotropic structure of the AAO, the strong correlation between mode-1 surface temperature and geopotential heights extend to the lower stratosphere, with the highest correlation occurring near 300 hPa. The intraseasonal variation of surface air temperature leads that of upper atmospheric circulation by one day. At the same time, the first mode is also closely associated with net upward longwave radiation and cloud cover.
It is well known that high-frequency (<8 days) eddies play an important role in the eddy–zonal flow interactions associated with the AAO (Rashid & Simmonds 2004). Whether the intraseasonal variation of surface air temperature, net upward longwave radiation and cloud cover originate from the synoptic processes needs to be explored further. A strong negative correlation between inversion strength and surface air temperature has been found in the analysis of individual daily vertical profiles of temperature (Phillpot & Zillman 1970). As a result, the intraseasonal variability of surface air temperature may influence that of inversion strength. Indeed, a recent study by Zhou et al. (2009) showed an intraseasonal variability in the near-surface stability and inversion strength using data from eastern Antarctica. The close link between surface inversion and the katabatic winds over Antarctica further suggests that the intraseasonal variability of surface air temperature may play an important role in modifying the strengths of katabatic winds. How the intraseasonal variability in surface temperature affects katabatic winds requires further study.
This study also examined the other main modes with eastward propagating characteristics. The large amplitudes of these eastward propagating waves appear over the Southern Ocean and the marginal region of Antarctica. The composite analyses reveal that the different phases of the 200-hPa streamfunction in the Southern Hemisphere correspond well to the variations of tropical convection. The spatial pattern of the leading mode is found to be similar to the PSA pattern or the atmospheric Rossby wave train (Mo & Higgins 1998). The 200-hPa streamfunction anomaly affects the 500-hPa geopotential heights, 10-m winds and surface air temperatures in the marginal zone of the Antarctica. Matthews & Meredith (2004) also found the relationship between the tropical atmospheric MJO and the atmospheric SAM during southern winters, but their periods of oscillation is longer, which may be due to their use of shorter term data (less than two years). A future study on the effect of the MJO on the intraseasonal variability over Antarctica is planned using general circulation models.
Acknowledgements
This study was supported by the National Natural Science Foundation of China (grant no. 40233032-40640420556), the Polar Science Strategy Research Foundation of China (grant no. 20080218), the Major State Basic; grant no. Research Development Program of China (973 Program) (No. 2010CB950301) and the Ministry of Science and Technology of China (grant nos. 2006BAB18B03 and 2006BAB18B05). The National Center for Atmospheric Research is sponsored by the US National Science Foundation.
References
Aiken C.M., England M.H. & Reason C.J.C. 2006.
Optimal growth of Antarctic circumpolar waves.
Journal of Physical Oceanography 36,
255–269.
[Crossref]
Ambach W. 1974.
The influence of cloudiness on the net radiation balance of a snow surface with high albedo.
Journal of Glaciology 13,
73–84.
Aoki S. 2002. Coherent sea level response to the Antarctic Oscillation.
Geophysical Research Letters 29, 1950, doi: 10.1029/2002GL015733.
[Crossref]
Arblaster J.M. & Meehl G.A. 2006.
Contributions of external forcings to Southern Annular Mode trends.
Journal of Climate 19,
2896–2905.
[Crossref]
Baba K., Minobe S., Kimura N. & Wakatsuchi M. 2006. Intraseasonal variability of sea-ice concentration in the Antarctic with particular emphasis on wind effect.
Journal of Geophysical Research—Oceans 111, C12023, doi: 10.1029/2005JC003052
[Crossref]
Baba K. & Wakatsuchi M. 2001.
Eastward propagation of the intraseasonal variability of sea ice and the atmospheric field in the marginal ice zone in the Antarctic.
Geophysical Research Letters 28,
3669–3672.
[Crossref]
Bonekamp H., Sterl A. & Komen G.J. 1999.
Interannual variability in the Southern Ocean from an ocean model forced by European Centre for Medium-Range Weather Forecasts reanalysis fluxes.
Journal of Geophysical Research—Oceans 104,
13317–13331.
[Crossref]
Bromwich D.H., Fogt R.L., Hodges K.I. & Walsh J.E. 2007. A tropospheric assessment of the ERA-40, NCEP, and JRA-25 global reanalyses in the polar regions.
Journal of Geophysical Research—Atmospheres 112, D10111, doi: 10.1029/2006JD007859.
[Crossref]
Burnett A.W. & McNicoll A.R. 2000.
Interannual variations in the Southern Hemisphere winter circumpolar vortex: relationships with the semiannual oscillation.
Journal of Climate 13,
991–999.
[Crossref]
Cai W. & Baines P.G. 2001.
Forcing the Antarctic Circumpolar Wave by El Niño–Southern Oscillation teleconnections.
Journal of Geophysical Research—Oceans 106,
9019–9038.
[Crossref]
Cai W., Baines P.G. & Gordon H.B. 1999.
Southern mid-to high-latitude variability, a zonal wavenumber-3 pattern, and the Antarctic Circumpolar Wave in the CSIRO coupled model.
Journal of Climate 12,
3087–3104.
[Crossref]
Carril A.F. & Navarra A. 2001.
Low-frequency variability of the Antarctic Circumpolar Wave.
Geophysical Research Letters 28,
4623–4626.
[Crossref]
Cebula R.P. & Deland M.T. 1998.
Comparisons of the NOAA-11 SBUV/2, UARS SOLSTICE, and UARS SUSIM Mg II solar activity proxy indexes.
Solar Physics 177,
117–132.
[Crossref]
Chen T.C. & Chen J.M. 1993.
The 10–20-day mode of the 1979 Indian monsoon: its relation with the time variation of monsoon rainfall.
Monthly Weather Review 121,
2465–2482.
[Crossref]
Christoph M., Barnett T.P. & Roeckner E. 1998.
The Antarctic Circumpolar Wave in a coupled ocean–atmosphere GCM.
Journal of Climate 11,
1659–1672.
[Crossref]
Enomoto H. & Ohmura A. 1990.
The influences of atmospheric half-yearly cycle on the sea ice extent in the Antarctic.
Journal of Geophysical Research—Oceans 95,
9497–9511.
[Crossref]
Farrara J.D., Ghil M., Mechoso C.R. & Mo K.C. 1989.
Empirical orthogonal functions and multiple flow regimes in the Southern Hemisphere winter.
Journal of the Atmospheric Sciences 46,
3219–3223.
[Crossref]
Fogt R.L. & Bromwich D.H. 2006.
Decadal variability of the ENSO teleconnection to the high-latitude south Pacific governed by coupling with the Southern Annular Mode.
Journal of Climate 19,
979–997.
[Crossref]
Francis G.L. & Salby M.L. 2001.
Radiative influence of Antarctica on the polar-night vortex.
Journal of the Atmospheric Sciences 58,
1300–1309.
[Crossref]
Ghil M. & Mo K. 1991.
Intraseasonal oscillations in the global atmosphere. Part II: Southern Hemisphere.
Journal of the Atmospheric Sciences 48,
780–790.
[Crossref]
Gong D. & Wang S. 1999.
Definition of Antarctic Oscillation index.
Geophysical Research Letters 26,
459–462.
[Crossref]
Grise K.M. & Thompson D.W.J. 2009.
On the role of radiative processes in stratosphere–troposphere coupling.
Journal of Climate 22,
4154–4161.
[Crossref]
Hall A. & Visbeck M. 2002.
Synchronous variability in the Southern Hemisphere atmosphere, sea ice, and ocean resulting from the Annular Mode.
Journal of Climate 15,
3043–3057.
[Crossref]
Harangozo S.A. 1997.
Atmospheric meridional circulation impacts on contrasting winter sea ice extent in two years in the Pacific sector of the Southern Ocean.
Tellus Series A 49,
388–400.
[Crossref]
Harangozo S.A. 2000.
A search for ENSO teleconnections in the west Antarctic Peninsula climate in Austral winter.
International Journal of Climatology 20,
663–679.
[Crossref]
Hartmann D.L. & Lo F. 1998.
Wave-driven zonal flow vacillation in the Southern Hemisphere.
Journal of the Atmospheric Sciences 55,
1303–1315.
[Crossref]
Holland G.J. 1986.
Interaanual variability of the Australian summer monsoon at Darwin: 1952–82.
Monthly Weather Review 114,
594–604.
[Crossref]
Hsu H.-H. & Weng S.-P. 2002.
Stratospheric Antarctic intraseasonal oscillation during the austral winter.
Journal of the Meteorological Society of Japan 80,
1029–1050.
[Crossref]
Jacobs G.A. & Mitchell J.L. 1996.
Ocean circulation variations associated with the Antarctic.
Geophysical Research Letters 23,
2947–2950.
[Crossref]
Kalnay E., Kanamitsu M., Collins W., Deaven D., Gandin L., Iredell M., Saha S., White G., Woollen J., Zhu Y., Chelliah M., Ebisuzaki W., Higgins W., Janowiak J., Mo K.C., Ropelewski C., Wang J., Leetmaa A., Reynolds R., Jenne R. & Joseph D. 1996.
The NCEP/NCAR 40-year reanalysis project.
Bulletin of the American Meteorological Society 77,
437–471.
[Crossref]
Kanamitsu M., Ebisuzaki W., Woollen J., Yang S.-K., Hnilo J.J., Fiorino M. & Potter G.L. 2002.
NCEP-DOE AMIP-II reanalysis (R-2).
Bulletin of the American Meteorological Society 83,
1631–1643.
[Crossref]
Karoly D.J. 1989.
Southern Hemisphere circulation features associated with El Niño–Southern Oscillation events.
Journal of Climate 2,
1239–1252.
[Crossref]
Keable M., Simmonds I. & Keay K. 2002.
Distribution and temporal variability of 500 hPa cyclone characteristics in the Southern Hemisphere.
International Journal of Climatology 22,
131–150.
[Crossref]
Kidson J.W. (1988a).
Interannual variations in the Southern Hemisphere circulation.
Journal of Climate 1,
1177–1198.
[Crossref]
Kidson J.W. (1988b).
Indices of the Southern Hemisphere zonal wind.
Journal of Climate 1,
183–194.
[Crossref]
Kidson J.W. 1991.
Intraseasonal variation in the Southern Hemisphere circulation.
Journal of Climate 4,
939–953.
[Crossref]
Kiladis G.N. & Mo K.C. 1999. Interannual and intraseasonal variability in the Southern Hemisphere. In D.J. Karoly & D.G. Vincent (eds.): Meteorology of the Southern Hemisphere. Pp. 307–336. Pennsylvania: American Meteor Society.
King J.C., Anderson P.S., Vaughan D.G., Mann G.W., Mobbs S.D. & Vosper S.B. 2004. Wind-borne redistribution of snow across an Antarctic ice rise.
Journal of Geophysical Research—Atmospheres 109, D11104, doi: 10.1029/2003JD004361 [Crossref]
Kistler R., Kalnay E., Collins W., Saha S., White G., Woollen J., Chelliah M., Ebisuzaki W., Kanamitsu M., Kousky V., van den Dool H., Jenne R. & Fiorino M. 2001.
The NCEP-NCAR 50-year reanalysis: monthly means CD-ROM and documentation.
Bulletin of the American Meteorological Society 82,
247–267.
[Crossref]
Krishnamurti T.N. & Ardunay P. 1980.
The 10–20-day westward propagating mode and “breaks” in the monsoon.
Tellus 32,
15–26.
[Crossref]
Krishnamurti T.N. & Bhalme H.N. 1976.
Oscillations of monsoon system. Part I: observational aspects.
Journal of the Atmospheric Sciences 45,
1937–1954.
[Crossref]
Lau M.K., Sheu P.J. & Kang I.S. 1994.
Multiscale low-frequency circulation modes in the global atmosphere.
Journal of the Atmospheric Sciences 51,
1169–1193.
[Crossref]
Liebmann B. & Smith C.A. 1996.
Description of a complete (interpolated) outgoing longwave radiation dataset.
Bulletin of the American Meteorological Society 77,
1275–1277.
Lima F.U.F. & Carvalho L.M.V. 2008.
Extreme intra-seasonal anomalies in the Amundsen and Bellingshausen sea-ice area, Antarctica, during the austral winter.
Annals of Glaciology 48,
58–64.
[Crossref]
Lu L., Bian L. & Zhang Y. 1989.
 (The medium oscillating characteristic of surface atmospheric variables at Great Wall Station in Antarctica.).
Chinese Journal of Polar Research 1(4),
12–19.
Lu L., Zhou J., Bian L., Zhang Z. & Zhen X. 1996.
1993 (The characteristics of the atmospheric oscillations at Prydz Bay during the Antarctic ozone hole in 1993.).
Chinese Science Bulletin 41(7),
636–639.
Madden R.A. & Julian P.R. 1971.
Description of a 40–50 day oscillation in the zonal wind in the tropical Pacific.
Journal of the Atmospheric Sciences 28,
702–708.
[Crossref]
Madden R.A. & Julian P.R. 1972.
Description of global-scale circulation cells in the tropics with a 40–50 day period.
Journal of the Atmospheric Sciences 29,
1109–1123.
[Crossref]
Matthews A.J. & Meredith M.P. 2004. Variability of Antarctic circumpolar transport and the Southern Annular Mode associated with the Madden–Julian Oscillation.
Geophysical Research Letters 31, L24312, doi: 10.1029/2004GL021666 [Crossref]
Mo K.C. & Higgins R.W. 1998.
The Pacific–South American modes and tropical convection during the Southern Hemisphere winter.
Monthly Weather Review 126,
1581–1596.
[Crossref]
Mo K.C. & Paegle J.N. 2001.
The Pacific–South American modes and their downstream effects.
International Journal of Climatology 21,
1211–1229.
[Crossref]
Murakami M. 1976.
Analysis of summer monsoon fluctuations over India.
Journal of the Meteorological Society of Japan 54,
15–31.
Nikias L.C. & Raghuveer M.R. 1987.
Bispectrum estimation: a digital signal processing framework.
Proceedings of the IEEE 75,
869–891.
[Crossref]
North G.R., Bell T.L., Cahalan R.F. & Moeng F.J. 1982.
Sampling errors in the estimation of empirical orthogonal functions.
Monthly Weather Review 110,
699–706.
[Crossref]
North G.R., Kim K.-Y., Shen S.S.P. & Hardin J.W. 1995.
Detection of forced climatic signals. Part I: filter theory.
Journal of Climate 8,
401–408.
[Crossref]
Pearson K. 1902.
On lines and plans of closest fit to system of point in space philos.
Magnetism 6,
559–572.
Phillpot H.R. & Zillman J.W. 1970.
The surface temperature inversion over the Antarctic continent.
Journal of Geophysical Research 75,
4161–4169.
[Crossref]
Rashid H.A. & Simmonds I. 2004.
Eddy–zonal flow interactions associated with the Southern Hemisphere Annular Mode: results from NCEP-DOE reanalysis and a quasi-linear model.
Journal of the Atmospheric Sciences 61,
873–888.
[Crossref]
Robinson W.A. 1991.
The dynamics of low-frequency variability in a simple model of the global atmosphere.
Journal of the Atmospheric Sciences 48,
429–441.
[Crossref]
Robinson W.A. 1996.
Does eddy feedback sustain variability in the zonal index?.
Journal of the Atmospheric Sciences 53,
3556–3569.
[Crossref]
Robinson W.A. 2000.
A baroclinic mechanism for the eddy feedback on the zonal index.
Journal of the Atmospheric Sciences 57,
415–422.
[Crossref]
Simmonds I. 2003. Modes of atmospheric variability over the Southern Ocean.
Journal of Geophysical Research—Oceans 108, 8078, doi: 10.1029/2000JC000542.
[Crossref]
Simmonds I. & Jacka T.H. 1995.
Relationships between the interannual variability of Antarctic sea ice and the Southern Oscillation.
Journal of Climate 8,
637–647.
[Crossref]
Simmonds I. & Jones D.A. 1998.
The mean structure and temporal variability of the semiannual oscillation in the southern extratropics.
International Journal of Climatology 18,
473–504.
[Crossref]
Simmonds I., Keay K. & Lim E.-P. 2003.
Synoptic activity in the seas around Antarctica.
Monthly Weather Review 131,
272–288.
[Crossref]
Simmonds I. & King J.C. 2004.
Global and hemispheric climate variations affecting the Southern Ocean.
Antarctic Science 16,
401–413.
[Crossref]
Simmonds I. & Law R. 1995.
Association between Antarctic katabatic flow and the upper level winter vortex.
International Journal of Climatology 15,
403–421.
[Crossref]
Stammerjohn S.E. & Smith R.C. 1996. Spatial and temporal variability of western Antarctic Peninsula sea ice coverage. In R.M. Ross et al. (eds.): Foundations for ecological research west of the Antarctic Peninsula. Pp. 81–104. Washington, D.C.: American Geophysical Union.
Thompson D.W.J. & Solomon S. 2002.
Interpretation of recent Southern Hemisphere climate change.
Science 296,
895–899.
[Crossref]
Thompson D.W.J. & Wallace J.M. 1998.
The Arctic Oscillation signature in wintertime geopotential height and temperature fields.
Geophysical Research Letters 25,
1297–1300.
[Crossref]
Thompson D.W.J. & Wallace J.M. 2000.
Annular modes in the extratropical circulation. Part I: month-to-month variability.
Journal of Climate 13,
1000–1016.
[Crossref]
Turner J. 2004.
Review the El Niño–Southern Oscillation and Antarctica.
International Journal of Climatology 24,
1–31.
[Crossref]
Turner J., Colwell S.R., Marshall G.J., Lachlan-Cope T.A., Carleton A.M., Jones P.D., Lagun V., Reid P.A. & Iagovkina S. 2004.
The SCAR READER project: toward a high-quality database of mean Antarctic meteorological observations.
Journal of Climate 17,
2890–2898.
[Crossref]
van Loon H. 1967.
The half-yearly oscillations in middle and high southern latitudes and the coreless winter.
Journal of the Atmospheric Sciences 24,
472–486.
[Crossref]
Venegas S.A. 2003.
The Antarctic Circumpolar Wave: a combination of two signals?.
Journal of Climate 16,
2509–2524.
[Crossref]
Walker G.T. 1923.
Correlation in seasonal variations of weather, VIII. A preliminary study of world-weather.
Memoirs of the Indian Meteorological Department 24(4),
75–131.
Walker G.T. 1924.
Correlation in seasonal variation of weather, IX. A further study of world-weather.
Memoirs of the Indian Meteorological Department 24(9),
275–332.
Walland D.J. & Simmonds I. 1999.
Baroclinicity, meridional temperature gradients, and the Southern Semiannual Oscillation.
Journal of Climate 12,
3376–3382.
[Crossref]
Watterson J.G. 2002.
Wave-mean flow feedback and the persistence of simulated zonal flow vacillation.
Journal of the Atmospheric Sciences 59,
1274–1288.
[Crossref]
Weickmann K.M. 1983.
Intraseasonal circulation and outgoing longwave radiation modes during Northern Hemisphere winter.
Monthly Weather Review 111,
1838–1858.
[Crossref]
Weickmann K.M., Lussky G.L. & Kutzbach J.E. 1985.
Intraseasonal (30–60 day) fluctuations of outgoing longwave radiation and 250 mb streamfunction during northern winter.
Monthly Weather Review 113,
941–961.
[Crossref]
Weisse R., Mikolajewicz U., Sterl A. & Drijfhout S.S. 1999.
Stochastically forced variability in the Antarctic Circumpolar Current.
Journal of Geophysical Research—Oceans 104,
11049–11064.
[Crossref]
Wheeler M.C. & Hendon H.H. 2004.
An all-season real-time multivariate MJO index: development of an index for monitoring and prediction.
Monthly Weather Review 132,
1917–1932.
[Crossref]
White W.B. & Annis J. 2004. Influence of the Antarctic Circumpolar Wave on El Niño and its multidecadal changes from 1950 to 2001.
Journal of Geophysical Research—Oceans 109, C06019, doi: 10.1029/2002JC001666.
[Crossref]
White W.B., Gloersen P. & Simmonds I. 2004.
Tropospheric response in the Antarctic Circumpolar Wave along the sea ice edge around Antarctica.
Journal of Climate 17,
2765–2779.
[Crossref]
White W.B. & Peterson R.G. 1996.
An Antarctic circumpolar wave in surface pressure, wind, temperature and sea-ice extent.
Nature 380,
699–702.
[Crossref]
White W.B. & Simmonds I. 2006. Sea surface temperature-induced cyclogenesis in the Antarctic circumpolar wave.
Journal of Geophysical Research—Oceans 111, C08011, doi: 10.1029/2004JC002395. [Crossref]
Wu M.L., Schubert S. & Huang N.E. 1999.
The development of the South Asian summer monsoon and intraseasonal oscillation.
Journal of Climate 12,
2054–2075.
[Crossref]
Wu R. & Wang B. 2001.
Multi-stage onset of the summer monsoon over the western North Pacific.
Climate Dynamics 17,
277–289.
[Crossref]
Yasunari T. & Kodama S. 1993.
Intraseasonal variability of katabatic wind over East Antarctica and planetary flow regime in the Southern Hemisphere.
Journal of Geophysical Research—Atmospheres 98,
13063–13070.
[Crossref]
Yu L., Zhang Z., Zhou M., Zhong S., Lenschow D., Hsu H., Wu H. & Sun B. 2009.
Validation of the ECMWF and NCEP-NCAR reanalysis data in Antarctica.
Advances in Atmospheric Sciences 27,
1151–1168.
[Crossref]
Yuan X. 2004.
ENSO-related impacts on Antarctic sea ice: a synthesis of phenomenon and mechanisms.
Antarctic Science 16,
415–425.
[Crossref]
Zhang Z., Xue Z., Xu Z., Zhang L., Yin T., Ren H., Yang Q. & Meng S. 2007.  (Physical climatology.) In Z. Gao (ed.):
  (Antarctic Meteorology and Climatology.) Pp.75–76. Beijing: Chinese Ocean Press.
Zhou M., Zhang Z., Zhong S., Lenschow D., Hsu H.-M., Yao W., Sun B., Gao Z., Li S., Bian X. & Yu L. 2009. Observation of the near-surface wind and temperature structures and their variations with topography and latitude in East Antarctica.
Journal of Geophysical Research—Atmospheres 114, D17115, doi: 10.1029/2008JD011611. [Crossref]