RESEARCH/REVIEW ARTICLE
Arctic climate change in an ensemble of regional CORDEX simulations
Torben Koenigk,1 Peter Berg2
& Ralf Döscher1
1 Rossby Centre, Swedish Meteorological and Hydrological Institute, Folkborgsvägen 17, SE-60176 Norrköping, Sweden
2 Hydrological Research Unit, Swedish Meteorological and Hydrological Institute, Folkborgsvägen 17, SE-60176 Norrköping, Sweden
Abstract
Fifth phase Climate Model Intercomparison Project historical and scenario simulations from four global climate models (GCMs) using the Representative Concentration Pathways greenhouse gas concentration trajectories RCP4.5 and RCP8.5 are downscaled over the Arctic with the regional Rossby Centre Atmosphere model (RCA). The regional model simulations largely reflect the circulation bias patterns of the driving global models in the historical period, indicating the importance of lateral and lower boundary conditions. However, local differences occur as a reduced winter 2-m air temperature bias over the Arctic Ocean and increased cold biases over land areas in RCA. The projected changes are dominated by a strong warming in the Arctic, exceeding 15°K in autumn and winter over the Arctic Ocean in RCP8.5, strongly increased precipitation and reduced sea-level pressure. Near-surface temperature and precipitation are linearly related in the Arctic. The wintertime inversion strength is reduced, leading to a less stable stratification of the Arctic atmosphere. The diurnal temperature range is reduced in all seasons. The large-scale change patterns are dominated by the surface and lateral boundary conditions so future response is similar in RCA and the driving global models. However, the warming over the Arctic Ocean is smaller in RCA; the warming over land is larger in winter and spring but smaller in summer. The future response of winter cloud cover is opposite in RCA and the GCMs. Precipitation changes in RCA are much larger during summer than in the global models and more small-scale change patterns occur.
Keywords
Arctic; climate variability; climate change; regional climate modelling; global climate modelling; CORDEX.
Correspondence
Torben Koenigk, Rossby Centre, Swedish Meteorological and Hydrological Institute, Folkborgsvägen 17, SE-60176 Norrköping, Sweden. E-mail: torben.koenigk@smhi.se
(Published: 9 March 2015)
Polar Research 2015. © 2015 T. Koenigk et al. This is an Open Access article distributed under the terms of the Creative Commons Attribution-NonCommercial 4.0 International License (http://creativecommons.org/licenses/by-nc/4.0/), permitting all non-commercial use, distribution, and reproduction in any medium, provided the original work is properly cited.
Citation: Polar Research 2015, 34, 24603, http://dx.doi.org/10.3402/polar.v34.24603
The Arctic is an important region for the entire world's climate system. Sea ice and snow dominate the heat and mass exchanges between atmosphere and ocean. Freshwater exports from the Arctic Ocean can potentially affect the meridional overturning circulation and therefore the entire world ocean circulation (Häkkinen 1999; Haak et al. 2003; Jungclaus et al. 2005; Koenigk et al. 2006). Observations show large changes in the Arctic climate system in recent decades (Symon et al. 2005; Solomon et al. 2007). The sea-ice cover and volume has dramatically been reduced (Comiso et al. 2008; Devasthale et al. 2013) and temperature increase is amplified compared to the global mean (Graversen & Wang 2009; Serreze et al. 2009; Koenigk & Brodeau 2014). Also, snow cover on the Arctic continents is subject to extreme changes with a much earlier onset of snowmelt and a strong reduction in summer snow extent (Brown & Robinson 2011). The atmospheric circulation might already have responded to changes of the Arctic surface with effects for mid-latitude climate. Results by many recent studies (Overland & Wang 2010; Petoukhov & Semenov 2010; Hopsch et al. 2012; Liu et al. 2012; Yang & Christensen 2012) indicated that the reduction of sea ice leads to reduced westerlies, a more negative North Atlantic Oscillation index and consequently colder mid-latitude winter conditions.
Third (CMIP3) and fifth (CMIP5) phase Climate Model Intercomparison Project simulations indicate an accelerated climate change in the Arctic compared to the recently observed changes (e.g., Chapman & Walsh 2007; Vavrus et al. 2012; Koenigk et al. 2013) with a possible total loss of sea ice in the second half of the 21st century (Holland et al. 2010; Massonnet et al. 2012; Wang & Overland 2012). However, the spread among models is large and only very few models are able to reproduce the observed trend in sea-ice extent (Stroeve et al. 2007; Stroeve et al. 2012). The CMIP5 model simulations show some improvements in reproducing the observed rapid sea-ice reduction in the last two decades compared to CMIP3 (Massonnet et al. 2012; Stroeve et al. 2012). Despite improvements, climate models still show a large spread in simulating historical and future climate conditions (Stroeve et al. 2012; Koenigk et al. 2014). The occurrence of the first total loss of sea ice in future climate projections using the Representative Concentration Pathways greenhouse gas concentration trajectories high emission scenario RCP8.5 varies between 2030 and 2100, depending on the model. Moreover, biases in air temperature and atmospheric circulation are considerable.
The resolution of most global climate models (GCMs) is still too coarse to adequately resolve important processes such as atmospheric circulation and its interaction with the ocean and sea ice or the topographical/orographical influence on the flow of water and air. Regional Arctic simulations allow for a higher spatial resolution and potentially improved representation of many relevant processes (Shkolnik & Efimov 2013) although even regional models are too coarse to resolve small-scale processes. Regional atmosphere stand-alone and coupled Arctic models with pan-Arctic domain have demonstrated skill for simulations of Arctic climate conditions when driven with reanalysis products (Mikolajewicz et al. 2005; Dorn et al. 2008; Döscher et al. 2010; Cassano et al. 2011). Some of the first coupled regional climate model simulations of future climate indicated a somewhat earlier Arctic summer sea-ice loss in the 21st century and larger ice extent variations than the global models (Koenigk et al. 2011; Döscher & Koenigk 2013). However, Tjernström et al. (2005) and Rinke et al. (2006), comparing different Arctic regional models to observations of the Surface Heat Budget of the Arctic Ocean project (Uttal et al. 2002), found large uncertainties particularly in the surface energy fluxes. Regional model simulations depend strongly on information at their lateral boundaries. Since this boundary driving is generally provided by independent global models operating at coarser spatial resolution, there is the potential for the interior regional climate model solution to become inconsistent with the driving model. It is therefore not certain that regional simulations are generally more reliable than global model simulations.
In this study, we use the regional Rossby Centre Atmosphere model (RCA) to downscale simulations with four different GMCs using two different emission scenarios. This is the largest set of Arctic regional future simulations existing so far and part of the Coordinated Regional Climate Downscaling Experiment (CORDEX; Giorgi et al. 2009; Jones et al. 2011).
We compare the performance of the regional downscaling simulations with the original global coupled scenarios at the end of the 20th century and analyse the simulated climate change in the 21st century in both regional and global models.
Model and simulations
Regional atmosphere model RCA
The regional Arctic scenario simulations are performed with RCA (Jones et al. 2004; Samuelsson et al. 2011). RCA is originally based on the numerical weather prediction model, High Resolution Limited Area Model (HIRLAM; Unden et al. 2002). It is a hydrostatic model using primitive equations. Here, we used the newest version—RCA4—which differs from previous RCA-versions described in Jones et al. (2004) and Samuelsson et al. (2011) in substantial recoding and updates particular of the surface processes. The soil hydrology is divided into a forest and an open land tile, soil carbon is included and snow albedo improved. Furthermore, RCA4 utilizes the freshwater lake model FLAKE (Mironov et al. 2010). RCA4 has already been used in studies by Nikulin et al. (2012) and Berg et al. (2013).
For this study, we performed simulations with RCA on a pan-Arctic region using the official Arctic-CORDEX area (see, e.g., http://wcrp-cordex.ipsl.jussieu.fr/index.php/community/domain-arctic-cordex or Fig. 1a) as also done in Berg et al. (2013). RCA runs in a horizontal resolution of 0.44° on a rotated latitude–longitude grid with the grid equator crossing the geographical North Pole. The current model set-up has 40 vertical layers in terrain-following hybrid coordinates with a model top at approximately 15 hPa.
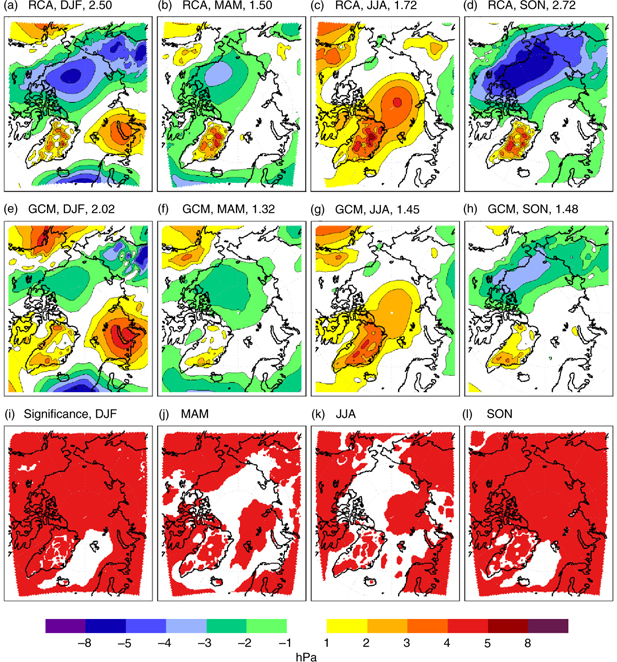
Fig. 1
Sea-level pressure (SLP) bias compared to the reanalysis data set by the European Centre for Medium-range Weather Forecasts (ERA-interim) for the period 1980–2005 in (a–d) the ensemble mean of Rossby Centre Atmosphere model (RCA) downscalings of global models (GCM) and (e–h) the ensemble mean of the global models. The projections are based on RCP8.5. The numbers in the titles (a–h) indicate the model area averaged root mean square error (in hPa). Red areas in (i–l) mark areas where the SLP biases in regional and global simulations are significantly different (at the 95% confidence level).
Simulations
RCA has been used to downscale historical simulations and future scenario projections from a selected number of CMIP5 models. The global models have been chosen based on existing lateral and surface boundary conditions for regional downscaling. From this subset of remaining models we selected four global models, which simulate sea-ice conditions, air temperature and atmospheric circulation reasonably well for the recent past but show a spread in their future response towards greenhouse gas forcing. These models are CanESM2, NorESM1-M, MPI-ESM-LR and EC-Earth2.3. For each of the global models, one historical simulation (1950–2005), followed by each one simulation according to RCP4.5 and RCP8.5 emission scenarios (2006–2100) have been downscaled with RCA. The temporal changes in the atmospheric constituents according to the respective scenario have been prescribed in the regional simulations as well.
In most cases, we will discuss the results of regional model and global model ensemble means including all simulations using the same emission scenarios. For calculating the significance of the differences between global model simulations and their regional model downscalings, we used a paired student t-test. A detailed description can be found in Von Storch & Zwiers (1999). If nothing else is stated, differences are called significant if the 95% significance level is reached.
The Arctic climate in RCA simulations forced with boundary conditions of the reanalysis data set by the European Centre for Medium-range Weather Forecasts (ECMWF), known as ERA-interim, have been discussed in Berg et al. (2013). Note, we do not use spectral nudging in our RCA downscaling simulations.
Results
Evaluation of the 20th century climate
Before analysing the Arctic climate change in future projections, we present a short overview of the performance of present-day climate in regional downscalings and global model simulations for the period 1980–2005. We compare the results to ERA-interim reanalysis (Dee et al. 2011). The Arctic is a data-sparse area and reanalysis provides a comprehensive set of variables for the Arctic. ERA-interim represents a newer generation of reanalysis compared to earlier products as, e.g., the reanalysis data set from the National Center for Atmospheric Research and National Centers for Environmental Protection and ERA-40 from the ECMWF. Note, that reanalysis data are not observations and to the extent of missing observations in the Arctic, data assimilation provides less value, although effects from more southerly locations with better observational coverage should have a positive impact. A recent study by Lindsay et al. (2014) points out ERA-interim as one of three reanalyses products most consistent with independent measurements in the Arctic.
Figure 1 shows the sea-level pressure (SLP) bias of the ensemble mean of both the regional downscalings and the global models for each season. Obviously, the lateral and lower boundary conditions strongly govern the response of the large-scale atmospheric circulation in the regional model. The bias patterns are similar in regional and global simulations, which indicate the importance of the lower and lateral boundary conditions from the global models for the regional downscalings. We find a slight amplification of the bias in the regional downscalings compared to the global models. The area averaged root mean square (RMS) error of the ensemble means is larger in RCA than in the GMCs, particularly in winter and autumn. Note that the area averaged RMS error does not provide any information about possible added value of the regional downscalings in sub-regions of the model area. In all seasons, the SLP bias patterns are dominated by a pressure gradient across the Arctic, which leads to anomalous winds towards the Siberian coast. Particularly in winter and autumn, this means reduced offshore winds at the Siberian coast, which is a typical problem in most coupled atmosphere–ocean models (Bitz et al. 2002; DeWeaver & Bitz 2006). RCA forced with ERA-interim data simulates a similar bias (Berg et al. 2013), which might contribute to the fact that the SLP bias tends to be slightly amplified in the RCA downscalings compared to the global models.
Despite the similarities between RCA and GCM bias patterns, the ensemble mean SLP biases in RCA and the GCMs are significantly different in most of the model area in winter and autumn—except for the Nordic seas—and over most land areas in spring and summer (Fig. 1i–l). Interestingly, the biases are already directly at the boundaries of the regional model area and significantly different in RCA and GCMs. This might indicate that the global model circulation is significantly changed by the transition of the signal into the regional model.
The 2-m air temperature (T2m) bias patterns of global and regional simulations show substantial differences (Fig. 2), which are significant in most of our regional model domain. Only in a few areas off the ice edge, the biases are not significantly different. In winter, the RCA bias is smaller over the Arctic Ocean than in the GCMs, which are substantially colder than ERA-interim. Also in spring and autumn, RCA simulates a higher T2m over the Arctic Ocean but with a small positive bias while the global models are 1–3°K colder than ERA-interim. In summer, both regional and global simulations are about 1°K colder than ERA-interim. Over land, RCA is too cold in spring and summer. Also the global models are too cold but less pronounced. The area averaged RMS error is smaller in winter and autumn in the ensemble mean of the downscalings compared to the GCMs’ RMS error but larger in spring and summer due to the large biases over land. Taking only the ocean areas into account, the RMS error is smaller in the downscalings in all seasons.
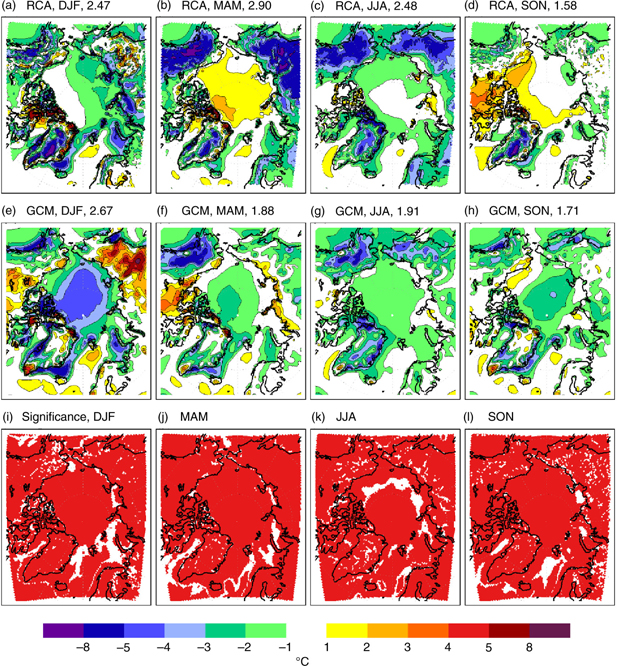
Fig. 2
Two-metre air temperature bias (in °C) compared to the reanalysis data set by the European Centre for Medium-range Weather Forecasts (ERA-interim) for the period 1980–2005 in (a–d) the ensemble mean of Rossby Centre Atmosphere model (RCA) downscalings of global models (GCM) and (e–h) the ensemble mean of the global models. The projections are based on RCP8.5. The numbers in the titles (a–h) indicate the model area averaged root mean square error (in hPa). Red areas in (i–l) mark areas where the 2-m air temperature biases in regional and global simulations are significantly different (at the 95% confidence level).
Analysing the performance of individual global models and their regional Arctic downscalings confirms that regional and global simulations have SLP biases of comparable magnitude (Fig. 3). The fact that biases of the ensemble mean of the RCA downscalings show a systematic amplification of the GCM biases while this is not the case if comparing individual GCM simulations and their RCA downscaling indicates that compensating of atmospheric circulation errors is larger among different GCMs as in their RCA downscalings. This indicates that the atmospheric circulation bias seen in RCA is not completely forced by the boundary conditions, as also shown by Kjellström et al. (2011) for RCA downscalings over Europe.
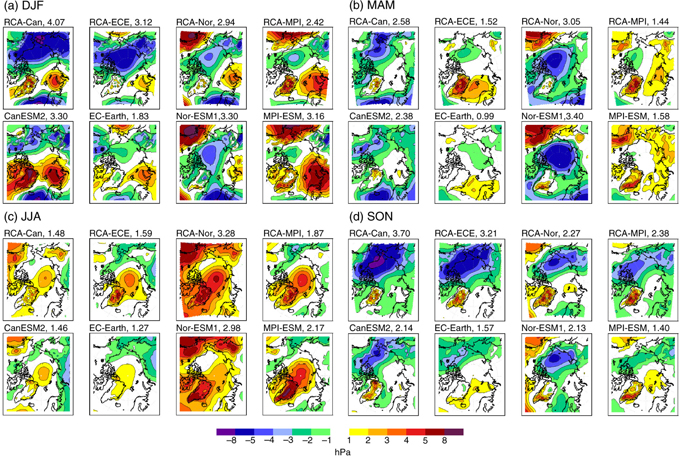
Fig. 3
Seasonal sea-level pressure bias compared to the reanalysis data set by the European Centre for Medium-range Weather Forecasts (ERA-interim) for the period 1980–2005 for the four individual Rossby Centre Atmosphere model downscalings (RCA-Can, RCA-ECE, RCA-Nor, RCA-MPI) and their global models (CanESM2, EC-Earth, Nor-ESM1, MPI-ESM) for (a) December–February, (b) March–May, (c) June–August and (d) September–November. The numbers in the titles indicate the model area averaged root mean square error (in hPa).
However, the bias patterns in the global models partly resemble each other in the Arctic—except for spring—which is different to the European results presented by Kjellström et al. (2011). The compensation effect of errors is therefore relatively small for the atmospheric circulation in the Arctic. The relation between magnitude of regional model biases and global model biases depends also on the global model. While the downscalings of the EC-Earth model show generally larger biases than EC-Earth itself, this is not true for the downscalings of the other three global models. Particularly, the downscalings of the MPI-ESM and NorESM 1 models provide a slight reduction of the bias in many regions in all seasons, except for autumn.
In summer and spring, smaller biases in the global simulations result in reduced biases in the regional downscalings, which indicates once again the importance of realistic boundary conditions for regional modelling. However, this feature is less pronounced during winter, where the downscalings of MPI-ESM and NorESM1 show the smallest RMS error despite relatively large biases in the global simulations. We speculate that this is mainly caused by error-compensation between the global and regional simulations. While CanESM2 and EC-Earth simulate a similar spatial pattern as RCA forced with ERA-interim, MPI-ESM and NorESM1 simulate a substantially different winter bias pattern.
Climate change in the 21st century
In the following, we analyse the climate change in our regional and the original global simulations in a near future period (2030–2049) and a far future period (2080–2099); the reference period is 1980–1999. In addition, we will discuss time-series from integrative parameters. For spatial change patterns, we will focus on the RCP8.5 scenario simulations. The results from the RCP4.5 simulations show nearly identical patterns with similar amplitudes until 2030; thereafter the amplitude of the change grows much quicker in RCP8.5 but change patterns remain similar in RCP4.5 and RCP8.5.
In the Arctic, sea-ice changes are an important source for atmospheric changes. Regional atmosphere models use the sea-ice concentration from their driving global models as lower boundary conditions, which reduces the degree of freedom in the climate change signal of the regional downscalings. Figure 4 shows the sea-ice concentration at the end of the 20th century and the sea-ice reduction in the 21st century in the four individual global models for September and March. Obviously, there is a large spread among these four models both in respect of the trend and the regions with largest ice reductions.
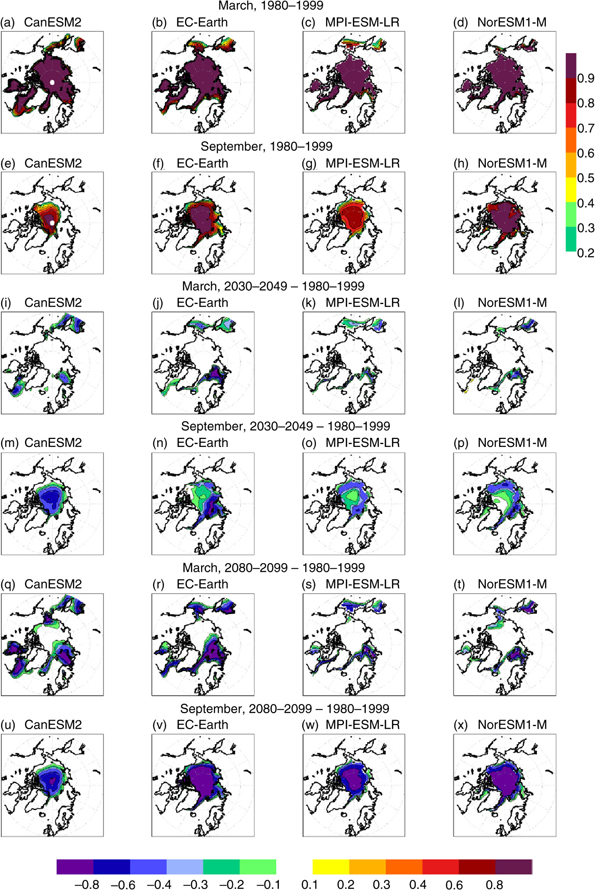
Fig. 4
(a–h) Sea-ice concentration in 1980–1999 and (i–x) simulated future change in the four global climate models (CanESM2, EC-Earth, Nor-ESM1, MPI-ESM) in March and September until 2030–2049 and 2080–2099. The projections are based on RCP8.5.
Atmospheric circulation
Figure 5 shows the future SLP change in ensemble means of the GCMs and RCA downscalings in all four seasons. The season with the most pronounced change is autumn; in the near future period, the entire Arctic shows a reduced SLP. This SLP reduction is likely related to the strong sea-ice area reduction in the Arctic Basin in autumn. While large areas of the Arctic Basin are still ice-free, the atmosphere starts to cool again in autumn, which causes strong upward surface heat fluxes resulting in vertical upward motion in the atmosphere. We speculate that this is the main reason for the autumn SLP reduction. Bhatt et al. (2008) found a SLP reduction in the Arctic and an increase over the North Pacific as a response to summer ice reductions. Studies analysing the atmospheric response to realistic winter anomalies (Alexander et al. 2004; Deser et al. 2004; Magnusdottir et al. 2004) revealed a local negative SLP response to sea-ice reductions but a negative Arctic Oscillation-like large-scale response. In winter, RCA and GCMs show a reduction of SLP over the Pacific Arctic sector and over the Barents Sea; over the North Atlantic, SLP is slightly increased. The SLP change in spring and summer is relatively small until 2030–2049. In the far future period (Fig. 5), the change is much more pronounced but the change patterns are almost the same as in the near future period. In autumn, SLP is reduced by up to 5 hPa in the Central Arctic. In winter and spring, SLP reduction is most pronounced over the Pacific sector, in summer over the Atlantic Arctic sector. The projected future changes of SLP are in both the near future and far future period very similar in the global models and their regional downscalings but we see a tendency towards slightly smaller changes in the regional simulations. The differences between ensemble mean SLP changes in RCA and GCMs are significant over some land regions, particularly in summer while they are mostly not significant over the Arctic Ocean. The regions of significant differences are the same for changes in the near future and the far future period but are somewhat extended in the later period. This indicates that the differences among regional and global simulations are robust. As for the SLP biases, the significant areas are often found along the southern boundaries of the regional model area. The treatment of the lateral boundaries might therefore be of more importance for differences of the large-scale atmospheric circulation in RCA and GCMs than different physical parameterization or the horizontal resolution.
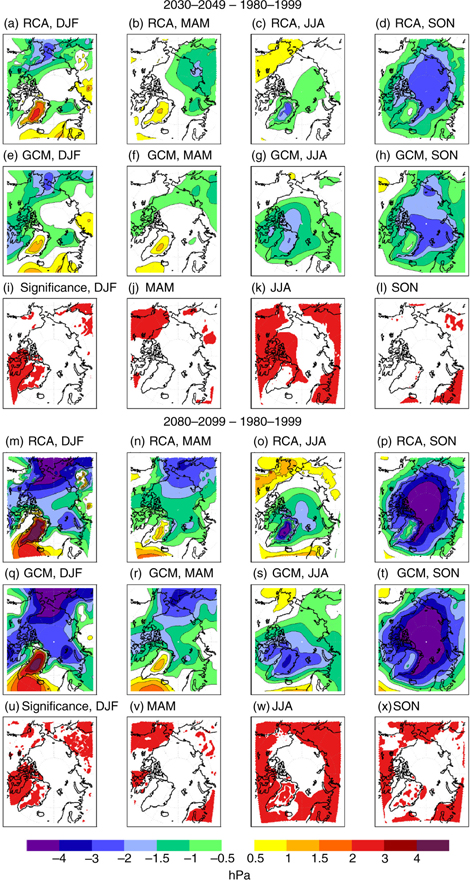
Fig. 5
Sea-level pressure future change in the ensemble means of the Rossby Centre Atmosphere model (RCA) downscalings and the global models (GCM) for the periods (a–l) 2030–2049 and (m–x) 2080–2099 compared to the reference period 1980–1999. The projections are based on RCP8.5. The red areas in (i–l) and (u–x) mark areas with significantly different responses in regional and global simulations (at the 95% confidence level).
Temperature
T2m shows the strongest change signal in autumn and winter (Fig. 6). In the near future period, the entire Arctic Ocean area shows an increase of 4–8°K. This agrees well with results from Screen & Simmonds (2010), who found the largest warming trend since 1989 in winter and autumn based on satellite observations. However, while during autumn the warming was concentrated between 82°N and 90°N, during winter the largest warming occurred between about 78°N and 85°N. Our model simulations show the same behaviour and this is very likely caused by the fact that sea-ice reduction in winter is strongest further to the south, in contrast to autumn, when it is concentrated to the Central Arctic.
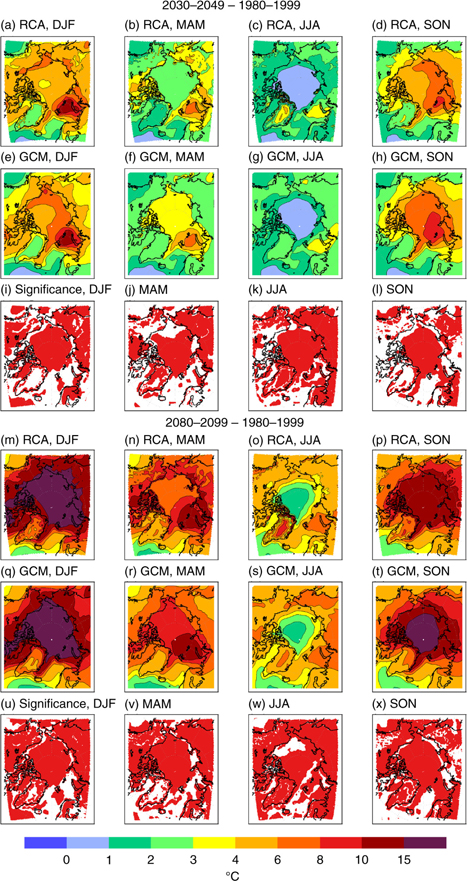
Fig. 6
Two-metre air temperature future change in the ensemble means of the Rossby Centre Atmosphere model (RCA) downscalings and the global models (GCM) for the periods (a–l) 2030–2049 and (m–x) 2080–2099 compared to the reference period 1980–1999. The projections are based on RCP8.5. The red areas in (i–l) and (u–x) mark areas with significantly different responses in regional and global simulations (at the 95% confidence level).
In summer, the warming is only moderate and T2m over the Arctic Ocean is hardly warming at all. This is because both melting ice and sea surface of open ocean areas in the Arctic Ocean have a temperature near 0°C in summer. As long as some sea ice is left in the Arctic Ocean, the water cannot warm up significantly during summer. Spatially, the strongest T2m warming undoubtedly takes place in the Barents Sea; this is the only larger region where sea ice disappears completely even during winter (Koenigk et al. 2013). This agrees with satellite-based results by Comiso (2006) and with findings in future projections with GCMs (Chapman & Walsh 2007; Koenigk et al. 2013).
Patterns and amplitudes agree relatively well between our regional and global model simulations. However, some interesting and significant differences occur: the T2m warming over the ocean is generally smaller and the warming over land is larger in winter and spring but reduced in summer in RCA. The gradient of temperature change between land and ocean is reduced by up to 4 K in RCA in winter and spring. If this is an effect of higher resolution in the regional model or if it is a characteristic of RCA remains unclear. In the far future period, the same behaviour occurs (Fig. 6). The warming is further amplified and reaches up to 20°K compared to the historical period in parts of the Arctic Ocean in winter. In summer, the warming over the Arctic Ocean is still much smaller but over most land areas, a T2m increase of 4–6°K occurs. The different behaviour of the temperature response in RCA and GCMs is significant over most of the Arctic Ocean and large parts of the Arctic land areas in both the near future and the far future period.
Figure 7 shows the relation between changes in sea-ice concentration and T2m averaged over 70–90°N. In winter, temperature rises abruptly in areas that become ice-free because strong heat fluxes from the warm ocean to the cold atmosphere will arise. The relation between sea-ice reduction and T2m increase seems to be linear until T2m changes of about 10°K: T2m is increased with about 0.7°K per 1% reduced ice concentration. For further ice concentration reductions exceeding about 15%, the additional T2m response seems to get slightly smaller: about 0.4°K per 1% ice reduction. We believe that this is due to the fact that the initial ice reduction and related strong upward heat fluxes warm the air and therefore reduce the temperature gradient at the surface and consequently the upward heat flux. Why the relationship is seemingly linear until about ice reductions of 15% (and thereafter again but with a reduced slope) remains unclear but might be due to the small number of models and time periods used in this study. The temperature response in the regional downscalings, averaged over 70–90°N is slightly smaller than in the GCMs. However, the difference between a downscaling and its GCM is much smaller than the spread among individual GCMs and downscalings of different GCMs.
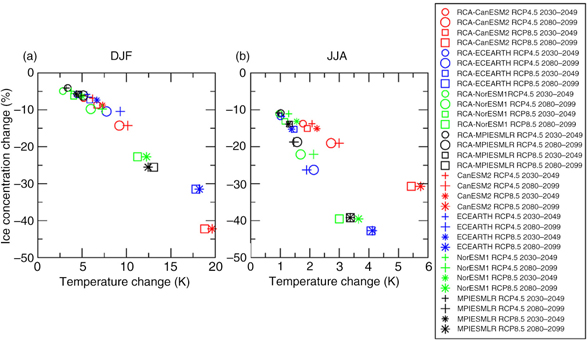
Fig. 7
Sea-ice concentration and temperature change until 2030–2049 (small symbols) and 2080–2099 (big symbols) averaged over 70–90°N in (a) winter (December–February) and (b) summer (June–August). Regional downscalings are represented by circles (RCP4.5) and squares (RCP8.5) and the global models are represented by plus signs (RCP4.5) and asterisks (RCP8.5); CanESM2 (red), EC-Earth (blue), NorESM1-M (green), MPI-ESM-LR (black). The reference period is 1980–1999.
As discussed above, ice surface and ice-free ocean temperatures are both near melting point in summer, which limits the temperature increase. Somewhat stronger T2m summer warming occurs only in ocean water areas away from melting ice and ice edge. However, despite a much smaller warming per 1% sea-ice reduction, the relationship between sea-ice concentration reduction and T2m increase averaged over 70–90°N is still close to linear. Again, we see a slight tendency towards a larger warming in the GCMs per 1% sea-ice reduction. CanESM2 and its downscalings simulate a larger warming for the same ice reduction as the other models, which all follow about the same line. The reason for this is probably that CanESM2 starts with the lowest summer ice concentration of the four models in the 20th century (Fig. 4). With further ice reduction in CanESM2, more ocean regions within 70–90°N are ice-free for a longer period during summer and the ocean surface and consequently T2m can warm up more than in the other models.
Figure 8 shows the development of the diurnal temperature range (DTR) averaged over 70–90°N in the 20th and 21st century. In the present-day period, both regional and global model simulations show a similar DTR with slightly larger values than the ERA-interim data. In the 21st century, the DTR is reduced; in RCP8.5 from 4.5°K to about 3.5°K in the regional simulations and to 3°K in the global simulations. In the RCP4.5 scenario, DTR is reduced by about 0.5 K in the GCMs and 0.3 K in RCA. In summer, the daily cycle is smaller than in winter and the global models show an approximate 0.3°K smaller DTR than the downscalings. Both models and reanalysis show a small negative trend in the period 1980–2005 and this negative trend continues throughout the 21st century but without accelerating. Rinke & Dethloff (2008) found in future projections with the regional model HIRHAM a similar reduction in DTR in both winter and summer. The largest reductions occurred over the future ice-free oceans in their simulations. Over open water and under maritime conditions, the DTR is generally smaller than over land and ice-covered areas (Tuomenvirta et al. 2000). The DTR difference between ocean and sea ice is much less pronounced during summer since the ice surface temperature is near the melting point and can vary much less than during winter. In the future winters, more open water areas and reduced ice thickness reduce the variability of the Arctic surface temperature. Thus, DTR is reduced in the Arctic and conditions head towards similar oceanic conditions as in summer. Also changes (increase) in cloud cover might contribute to a reduced DTR by reducing the incoming short wave radiation during the day (Dai et al. 1999; Stone & Weaver 2003). However, in the Arctic this effect only plays a role in the summer season.
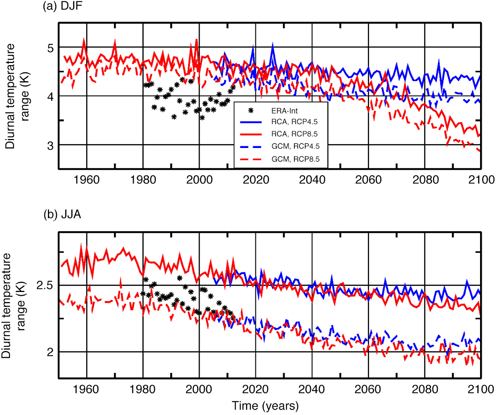
Fig. 8
Diurnal temperature range in (a) winter and (b) summer in the historical and future scenario simulations of the Rossby Centre Atmosphere model (RCA) and their driving global models (GCM). Shown are ensemble means averaged over 70–90°N. Also shown are values for to the reanalysis data set by the European Centre for Medium-range Weather Forecasts (ERA-Int).
The near-surface wintertime temperature inversion is one of the main characteristics of the Arctic atmosphere and leads to a very stable atmospheric stratification in the Arctic (Serreze et al. 1992, Devasthale et al. 2010). Here, we use the difference between temperature at 850 hPa and at 2m height as index (Fig. 9). In the models, the temperature at 850 hPa is about 7°K higher than near the surface in the 20th century if averaging over the area 70–90°N. This compares to a difference of roughly 5°K in the ERA-interim data. Similar to our results, Medeiros et al. (2011) found that most CMIP3 models slightly overestimate today's Arctic winter temperature inversion. In our future projections, the inversion is strongly reduced, down to about 3°K in RCP4.5 and disappears entirely in the RCP8.5 scenario at the end of the 21st century. Spatially, the change in inversion varies a lot (not shown); wherever the ice is strongly reduced, the inversion is as well. The inversion disappears in the Barents Sea (Koenigk et al. 2013) and the Bering Sea in the near future and advances into the Central Arctic in the farther future with the northward moving ice edge. Bintanja et al. (2011) argued that the surface inversion intensifies Arctic amplification, because the ability of the Arctic wintertime clear-sky atmosphere to cool to space decreases with inversion strength.
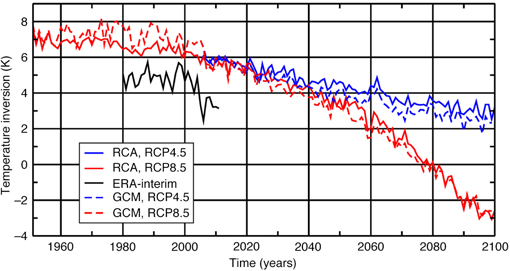
Fig. 9
Wintertime near-surface temperature inversion (difference between temperature at 850hPa and 2-m air temperature) in the ensemble mean of the Rossby Centre Atmosphere model (RCA) simulations and the global model simulations (GCM). Also shown are values for to the reanalysis data set by the European Centre for Medium-range Weather Forecasts (ERA-interim).
Clouds and precipitation
Figure 10 shows the total cloud cover (TCC) in the Arctic, averaged over 70–90°N. In the 20th century, TCC differs strongly between regional downscalings and the global models. While RCA simulates a TCC of more than 85%, the ensemble mean of the GCMs reaches about 70% in winter. However, the four global models show a large spread; TCC reaches about 40% in NorESM1-M, 65% in CanESM2 and 80% in EC-Earth and MPI-ESM-LR (not shown). Karlsson & Svensson (2013) analysed the TCC for a large number of CMIP5 models and found values for the historical period varying between roughly 30 and 90% in winter. Our regional downscalings do not show any spread, so TCC in the 20th century is obviously rather independent of the global model. It seems likely that differences in TCC in RCA and GCMs are mainly due to different treatment of physical processes and not a matter of different resolution. TCC in ERA-interim varies between 80 and 90% in winter; in contrast, the CMSAF-CLARA-A1 (Karlsson et al. 2013; Riihelä et al. 2013) and MODIS (http://modis-atmos.gsfc.nasa.gov/index.html) satellite cloud products indicate much lower TCC. Interannual variability is extremely high in CLARA-A1 and uncertainties in cloud clover of these satellite-derived values are large during winter time. The future change of winter cloud cover is relatively small in our projections. Interestingly, the global models simulate a slight increase of clouds while the regional downscalings show a slight decrease towards the end of the 21st century. The future change is model dependent and varies between 0 and 10% increase in the GCMs and a slight 0–7% decrease in RCA. The GCMs with larger increase are connected to a smaller decrease in their respective RCA downscalings, indicating that the future change of TCC in RCA is not entirely independent of the driving GCM. The TCC decrease in RCA goes along with a reduction of low clouds (not shown) and is mainly due to the reduced surface temperature inversion in the Arctic (Fig. 9). The spatial distribution of TCC change (not shown) indicates the largest reduction of low clouds in the Barents Sea area, which is the area where sea ice and temperature inversion disappear first. Obviously, the response to reduced sea ice and inversion is the opposite in the GCMs. The reason for the different behaviour remains unclear.
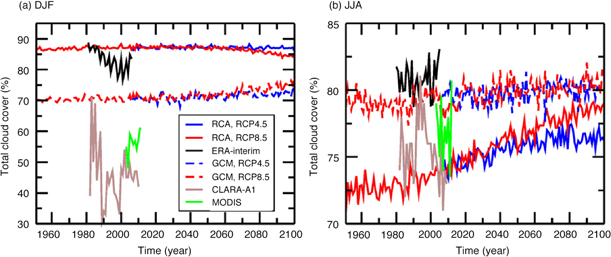
Fig. 10
Total cloud cover in the ensemble mean of the Rossby Centre Atmosphere model (RCA) downscalings, the ensemble mean of the global models (GCM), the reanalysis data set by the European Centre for Medium-range Weather Forecasts (ERA-interim) and CALRA-A1 and MODIS satellite products in (a) winter (December–February) and (b) summer (June–August).
In summer, uncertainties in the representation of clouds in satellite products and reanalysis data are smaller than in winter. They suggest a mean TCC of about 75–82% for the end of the 20th century/beginning of the 21st century. The regional downscalings simulate a mean TCC of 73% and the GCMs 79% for this period. Again, the four GCMs show a substantial spread (70–90%) while there is hardly any spread in the regional downscalings (72–74%). The entire CMIP5 range shows TCC between 50 and 90% (Karlsson & Svensson 2013). Both GCMs and RCA simulate an increasing TCC in the 21st century but the trend is more pronounced in RCA. In RCA, the cloud changes are dominated by low-level clouds (not shown).
Precipitation (P) is increasing in all seasons almost everywhere in the Arctic (Fig. 11). In the near future period, the increase varies between 2 and 10 mm/month in most areas; in the Barents Sea and along some mountain ranges substantially more. The largest increase occurs in autumn. The change pattern and the amplitude agree in regional downscalings and their global originals. However, we see more small-scale variations in the regional results over land areas and near the coastlines, probably due to the higher resolution and better-resolved topography compared to the global models. Many of these small-scale patterns in RCA are significantly different from the global model results. The P increase continues until the end of the 21st century; the largest P-changes still occur in autumn. The further increase of P over the Arctic Ocean after 2030–2049 is particularly large in winter and autumn. Kattsov et al. (2007) investigated the CMIP3 ensemble, and found results similar to those presented here, with an increase of P in the entire Arctic both in summer and winter. Furthermore, they found the largest increase in the Barents Sea area and the Chukchi Sea in winter and summer, respectively. A similar change pattern was also found in regional downscalings with HIRHAM of the ECHAM5/MPI-OM global model by Rinke & Dethloff (2008). However, their results indicate an increase of P up to 500% in the Barents Sea area, which is much more than in our model ensemble mean. On the contrary, results from Vavrus et al. (2012) using CCSM4 indicated a more uniformly distributed P-increase in the Arctic.
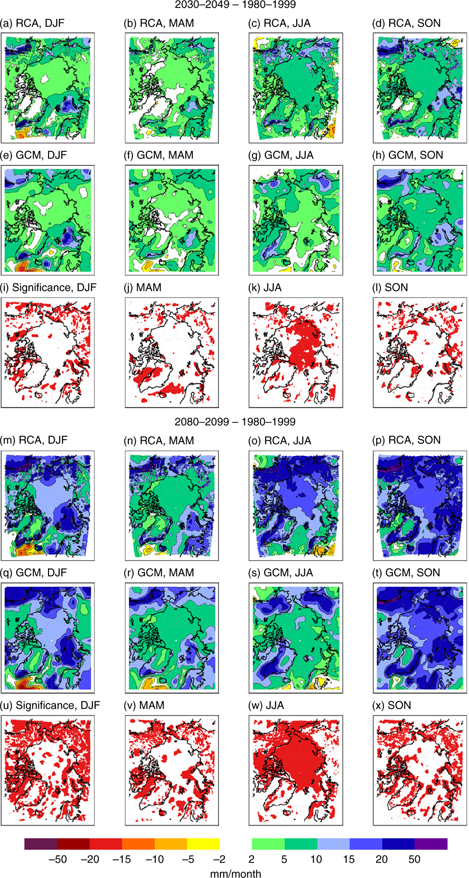
Fig. 11
Precipitation future change in the ensemble means of the Rossby Centre Atmosphere model (RCA) downscalings and the global models (GCM) for the periods (a–l) 2030–2049 and (m–x) 2080–2099 compared to the reference period 1980–1999. The projections are based on RCP8.5. The red areas in (i–l) and (u–x) mark areas with significantly different responses in regional and global simulations (at the 95% confidence level).
Interestingly, our regional downscalings simulate a significantly larger P change than the original global future projections in summer. The reason for this strong P-increase in RCA compared to the GCMs remains unclear. In both GCMs and downscalings, the convective precipitation part is very small in the Arctic throughout the entire year and we do not find any indications for more summer cyclonic activity in RCA (Fig. 5). However, Fig. 10 indicated a stronger increase in cloud cover in RCA compared to the GCMs, which might be related to enhanced P in RCA.
Figure 12 shows a linear relationship between the projected future changes of T2m and P in the Arctic. This relationship is the same for the GCMs and the regional downscalings in winter. A warming of 1°K over the 70–90°N area is connected to an average P-increase of about 0.8 mm/month in the same area. This relation is obviously independent of the time period and the emission scenario and is stable across all global models and their regional downscalings. The spread among individual global models is slightly larger than in the regional downscalings, which might indicate that the connection of winter precipitation to Arctic warming in RCA is independent of the large-scale boundary conditions. Also in summer, T2m and P seem to be linearly related. However, the P increase per K T2m-increase is much larger than in winter (note the change in scale of the x-axis in Fig. 12) and is substantially different between GCMs and the regional downscalings. While the P increase in the GCMs is about 2 mm/month per K T2m-increase, it is >3 mm/month in RCA (compare also Figs. 11c, k, j, o). In contrast to winter, the spread among individual downscalings is not smaller than among individual GCMs.
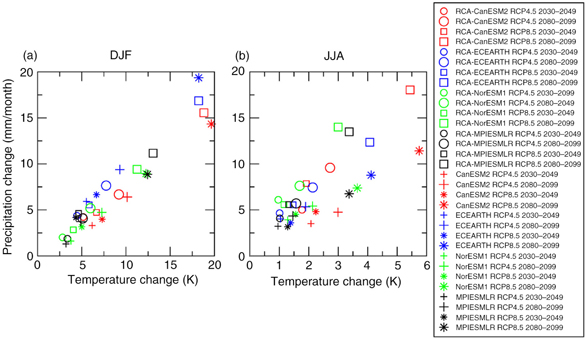
Fig. 12
Precipitation and temperature change until 2030–2049 (small symbols) and 2080–2099 (big symbols) averaged over 70–90°N in (a) winter and (b) summer. Regional downscalings are represented by circles (RCP4.5) and squares (RCP8.5) and the global models are represented by plus signs (RCP4.5) and asterisks (RCP8.5); CanESM2 (red), EC-Earth (blue), NorESM1-M (green), MPI-ESM-LR (black). The reference period is 1980–1999.
Summary and conclusions
In this study, we performed an ensemble of regional Arctic future projections as part of the CORDEX-project. The Rossby Centre Atmosphere model RCA4 has been used to downscale future climate projections based on RCP4.5 and RCP8.5 emission scenarios of four different global CMIP5 models.
The model biases in RCA are of similar size as in the driving global models. The atmospheric circulation in the regional downscalings is strongly governed by the lateral and surface boundary conditions from the global models. The regional downscalings therefore do not provide any added value to the large-scale atmospheric circulation. Note, all regional simulations have been performed without spectral nudging. As Berg et al. (2013) showed, spectral nudging towards ERA-interim reanalysis improved 20th century climate in RCA. However, performing spectral nudging towards the global models is debated since it reduces the possibility of the regional model to improve the prescribed global climate conditions. On the other hand, this study showed that the large-scale atmospheric circulation in the regional model is not improved compared to the global models. Contrary to SLP, air temperature shows larger deviations between regional and global model simulations. Particularly over the Arctic Ocean, the T2m bias is significantly reduced. Instead, it is increased over some land areas. Considering the entire model area, the added value of the regional downscalings is limited for the air temperature as well, although studies focusing on specific regions might benefit from the downscaling effort.
The future projections show large climate changes in the Arctic until the end of this century. The largest response occurs in autumn and winter with a temperature increase of up to 15°K and strongly reduced SLP. Precipitation is enhanced in all seasons with the largest increase in areas of sea-ice loss. The winter time inversion strength will be reduced in future which leads to a less stable stratification of the Arctic atmosphere. The DTR will be reduced in all seasons.
The changes in sea ice are the strongest influencing factor for the climate changes presented here. This relates to SLP, temperature, precipitation, inversion, DTR and to some extent cloud cover. Future changes are therefore very similar for regional climate models (RCMs) and GCMs due to the lateral boundary conditions and due to the prescribed sea ice and sea-surface temperature. Despite these similarities, we found some interesting significant differences between regional and global simulations: the warming over the Arctic Ocean is generally smaller in RCA, the warming over land is larger in RCA in winter and spring but smaller in summer. The temperature response over the Arctic Ocean and the surrounding land areas is of similar size in RCA while the global models simulate a larger response over the Arctic Ocean. It remains unclear if the higher resolution in the regional model and a possible better representation of small-scale flows plays a role for this behaviour or if it is just a special feature of RCA. To explore this more in future, simulations with the same regional and global models using different resolution would be required. The response of winter cloud cover is opposite in our RCM simulations and the GCMs indicating the importance of the microphysics parameterization. Precipitation changes in RCA are significantly larger during summer than in the GCMs and we see more small-scale change patterns, likely due to the better-resolved topography.
Near-surface temperature and precipitation are found to be linearly related in the Arctic. For the area 70–90°N, we found an average increase of 0.8 mm/month per 1°K warming in winter for both the global models and our regional downscalings in the 21st century. In summer, the precipitation-increase per K is much larger than in winter and is substantially different between GCMs (about 2 mm/K) and the regional downscalings (3 mm/K).
This study shows that we cannot assume that regional model results generally outmatch their driving global model simulations for the historical time period and that they are generally more reliable for the future. The added value of the regional downscaling with RCA for the parameters analysed in this study seems to be limited. However, note that we only used one regional model in one specific region and analysed a limited number of variables. Furthermore, the regional simulations were performed at a 50 km resolution, which is still too coarse to resolve many important processes. Future work should explore if regional simulations reaching the grey zone or even higher resolution show enhanced added value. It is therefore too early to make general conclusions on the added value of regional model simulations but it is becoming clear that regional model simulations need to be carefully evaluated before using for impact and adaptation studies.
The use of regional coupled atmosphere–ocean–sea-ice models has the potential to increase the added value from regional downscalings in the Arctic under the assumption that the sea ice is more realistic simulated in the regional model. However, since sea-ice distribution is highly sensitive to the atmospheric circulation, this assumption is not necessarily valid.
An upcoming study will focus on a more detailed representation of extremes in regional Arctic simulations since this is often pointed out as the main benefit of regional climate models.
Another interesting fact requiring more research in future is that spatial change patterns in the future scenario simulations are very similar in near and far future periods and across emission scenarios. It is mainly the amplitude of the response which differs. Therefore, observed change patterns could provide valuable indications for future climate changes.
Acknowledgements
This study has been made possible by support of the Rossby Centre at the Swedish Meteorological and Hydrological Institute together with the Swedish Research Council Formas financed project ADSIMNOR and the FP7-EU-project COMBINE. The computations have been performed at the National Supercomputer Centre at Linköping University. We acknowledge the World Climate Research Programme's Working Group on Coupled Modelling, which is responsible for CMIP, and we thank the modelling groups for producing and publishing their model output.
References
Alexander
M.A.,
Bhatt
U.S.,
Deser
C.,
Walsh
J.E.,
Timlin
M.S.,
Miller
J.S.
&
Scott
J. 2004.
The atmospheric response to realistic Arctic sea ice anomalies in an AGCM during winter. Journal of Climate 17,
890–905.
Berg
P.,
Döscher
R.
&
Koenigk
T. 2013.
Impacts of using spectral nudging on regional climate model RCA4 simulations of the Arctic. Geoscience Model Development 6,
849–859.
Publisher Full Text
Bhatt
U.S.,
Alexander
M.A.,
Deser
C.,
Walsh
J.E.,
Miller
J.S.,
Timlin
M.S.,
Scott
J.
&
Tomas
R.A. 2008.
The atmospheric response to realistic reduced summer Arctic sea ice anomalies. Geophysical Monograph Series 180,
91–110.
Bintanja
R.,
Graversen
R.G.
&
Hazeleger
W. 2011.
Arctic winter warming amplified by the thermal inversion and consequent low infrared cooling to space. Nature Geoscience 4,
758–761.
Publisher Full Text
Bitz
C.,
Fyfe
J.
&
Flato
G. 2002.
Sea ice response to wind forcing from AMIP models. Journal of Climate 15,
522–536.
Brown
R.D.
&
Robinson
A.D. 2011.
Northern Hemisphere spring snow cover variability and change over 1922–2010 including an assessment of uncertainty. The Cryosphere 5,
219–229.
Publisher Full Text
Cassano
J.J.,
Higgins
M.E.
&
Seefeldt
M.W. 2011.
Performance of the Weather Research and Forecasting model for month-long pan-Arctic simulations. Monthly Weather Review 139,
3469–3484.
Publisher Full Text
Chapman
W.L.
&
Walsh
J.E. 2007.
Simulations of Arctic temperature and pressure by global coupled models. Journal of Climate 20,
609–632.
Publisher Full Text
Comiso
J.C. 2006.
Arctic warming signals from satellite observations. Weather 61(3),
70–76.
Publisher Full Text
Comiso
J.C.,
Parkinson
C.,
Gersten
R.
&
Stock
L.
2008. Accelerated decline in the Arctic sea ice cover. Geophysical Research Letters
35, L01703, doi: 10.1029/2007GL031972.
Publisher Full Text
Dai
A.,
Trenberth
K.E.
&
Karl
T.R. 1999.
Effects of clouds, soil moisture, precipitation, and water vapour on diurnal temperature range. Journal of Climate 12,
2451–2473.
Dee
D.P.,
Uppala
S.M.,
Simmons
A.J.,
Berrisford
P.,
Poli
P.,
Kobayashi
S.,
Andrae
U.,
Balmaseda
M.A.,
Balsamo
G.,
Bauer
P.,
Bechtold
P.,
Beljaars
A.C.M.,
van de Berg
L.,
Bidlot
J.,
Bormann
N.,
Delsol
C.,
Dragani
R.,
Fuentes
M.,
Geer
A.J.,
Haimberger
L.,
Healy
S.B.,
Hersbach
H.,
Hólm
E.V.,
Isaksen
L.,
Kållberg
P.,
Köhler
M.,
Matricardi
M.,
McNally
A.P.,
Monge-Sanz
B.M.,
Morcrette
J.-J.,
Park
B.-K.,
Peubey
C.,
de Rosnay
P.,
Tavolato
C.,
Thépaut
J.-N.
&
Vitart
F. 2011.
The ERA-Interim reanalysis: configuration and performance of the data assimilation system. Quarterly Journal of the Royal Meteorological Society 137,
553–597.
Publisher Full Text
Deser
C.,
Magnusdottir
G.,
Saravanan
R.
&
Philips
A. 2004.
The effects of North Atlantic SST and sea ice anomalies on the winter circulation in CCM3. Part II: direct and indirect components of the response. Journal of Climate 17,
877–889.
Devasthale
A.,
Sedlar
J.,
Koenigk
T.
&
Fetzer
E.J. 2013.
The thermodynamic state of the Arctic atmosphere observed by AIRS: comparisons during the record minimum sea ice extents of 2007 and 2012. Atmospheric Chemistry and Physics 13,
7441–7450.
Publisher Full Text
Devasthale
A.,
Willen
U.,
Karlsson
K.G.
&
Jones
C.G. 2010.
Quantifying the clear-sky temperature inversion frequency and strength over the Arctic Ocean during summer and winter seasons from AIRS profiles. Atmospheric Chemistry and Physics 10,
5565–5572.
Publisher Full Text
DeWeaver
E.
&
Bitz
C.M. 2006.
Atmospheric circulation and its effect on Arctic sea ice in CCSM3 simulations at medium and high resolution. Journal of Climate 19,
2415–2436.
Publisher Full Text
Dorn
W.,
Dethloff
K.,
Rinke
A.
&
Kurgansky
M. 2008.
The recent decline of the Arctic summer sea-ice cover in the context of internal climate variability. The Open Atmospheric Science Journal 2,
91–100.
Publisher Full Text
Döscher
R.
&
Koenigk
T. 2013.
Arctic rapid sea ice loss events in regional coupled climate scenario experiments. Ocean Science 9,
217–248.
Publisher Full Text
Döscher
R.,
Wyser
K.,
Meier
H.E.M.,
Qian
M.
&
Redler
R. 2010.
Quantifying Arctic contributions to climate predictability in a regional coupled ocean–ice–atmosphere model. Climate Dynamics 34,
1157–1176.
Publisher Full Text
Giorgi
F.,
Jones
C.
&
Asnar
G.R. 2009.
Addressing climate information needs at the regional level: the CORDEX framework. WMO Bulletin 58,
175–183.
Graversen
R.G.
&
Wang
M. 2009.
Polar amplification in a coupled climate model with locked albedo. Climate Dynamics 33,
629–643.
Publisher Full Text
Haak
H.,
Jungclaus
J.,
Mikolajewicz
U.
&
Latif
M.
2003. Formation and propagation of great salinity anomalies. Geophysical Research Letters 30, article no. 1473, doi: 10.1029/2003GL017065.
Publisher Full Text
Häkkinen
S. 1999.
A simulation of thermohaline effects of a great salinity anomaly. Journal of Climate 6,
1781–1795.
Holland
M.M.,
Serreze
M.C.
&
Stroeve
J. 2010.
The sea ice mass budget of the Arctic and its future change as simulated by coupled climate models. Climate Dynamics 34,
185–200.
Publisher Full Text
Hopsch S., Cohen J. & Dethloff K. 2012. Analysis of a link between fall Arctic sea ice concentration and atmospheric patterns in the following winter. Tellus Series A
64, article no. 18624, doi: 10.3402/tellusa.v64i0.18624.
Publisher Full Text
Jones
C.G.,
Giorgi
F.
&
Asnar
G. 2011.
The Coordinated Regional Downscaling Experiment: CORDEX; an international downscaling link to CMIP5. CLIVAR Exchanges 56,
34–40.
Jones
C.G.,
Willén
U.,
Ullerstig
A.
&
Hansson
U. 2004.
The Rossby Centre Regional Atmospheric Climate Model part I: model climatology and performance for the present climate over Europe. Ambio 33,
199–210.
Jungclaus
J.H.,
Haak
H.,
Latif
M.
&
Mikolajewicz
U. 2005.
Arctic–North Atlantic interactions and multidecadal variability of the meridional overturning circulation. Journal of Climate 18,
4013–4031.
Publisher Full Text
Karlsson
J.
&
Svensson
G. 2013.
Consequences of poor representation of Arctic sea-ice albedo and cloud-radiation interactions in the CMIP5 model ensemble. Geophysical Research Letters 40,
4374–4379.
Publisher Full Text
Karlsson
K.G.,
Riihelä
A.,
Müller
R.,
Meirink
J.F.,
Sedlar
J.,
Stengel
M.,
Lockhoff
M.,
Trentmann
J.,
Hollmann
R.
&
Wolters
E. 2013.
CLARA-A1: the CM SAF cloud, albedo and radiation dataset from 28 yr of global AVHRR data. Atmospheric Chemistry and Physics 13,
5351–5367.
Publisher Full Text
Kattsov
V.M.,
Walsh
J.E.,
Chapman
W.L.,
Govorkova
V.A.,
Pavlova
T.V.
&
Zhang
X. 2007.
Simulation and projection of Arctic freshwater budget components by the IPCSS AR4 global climate models. Journal of Climate 8,
571–589.
Kjellström
E.,
Nikulin
G.,
Hansson
U.
&
Strandberg
G. 2011.
21st century changes in the European climate: uncertainties derived from an ensemble of regional climate model simulations. Tellus Series A 63,
24–40.
Publisher Full Text
Koenigk
T.
&
Brodeau
L. 2014.
Ocean heat transport into the Arctic in the twentieth and twenty-first century in EC-Earth. Climate Dynamics 42,
3101–3120.
Publisher Full Text
Koenigk
T.,
Brodeau
L.,
Graversen
R.G.,
Karlsson
J.,
Svensson
G.,
Tjernström
M.,
Willen
U.
&
Wyser
K. 2013.
Arctic climate change in 21st century CMIP5 simulations with EC-Earth. Climate Dynamics 40,
2720–2742.
Publisher Full Text
Koenigk
T.,
Devasthale
A.
&
Karlsson
K.G. 2014.
Summer sea ice albedo in the Arctic in CMIP5 models. Atmospheric Chemistry and Physics 14,
1987–1998.
Publisher Full Text
Koenigk
T.,
Döscher
R.
&
Nikulin
G. 2011.
Arctic future scenario experiments with a coupled regional climate model. Tellus Series A 63,
69–86.
Publisher Full Text
Koenigk
T.,
Mikolajewicz
U.,
Haak
H.
&
Jungclaus
J. 2006.
Variability of Fram Strait sea ice export: causes, impacts and feedbacks in a coupled climate model. Climate Dynamics 26,
17–34.
Publisher Full Text
Lindsay
R.,
Wensnahan
M.,
Schweiger
A.
&
Zhang
J. 2014.
Evaluation of seven different atmospheric reanalysis products in the Arctic. Journal of Climate 27,
2588–2606.
Publisher Full Text
Liu
J.,
Curry
J.A.,
Wang
H.,
Song
M.
&
Horton
R.M. 2012.
Impact of declining Arctic sea ice on snowfall. Proceedings of the National Academy of Sciences of the United States of America 109(11),
4074–4079.
Publisher Full Text
Magnusdottir
G.,
Deser
C.
&
Saravanan
R. 2004.
The effects of North Atlantic SST and sea ice anomalies on the winter circulation in CCM3. Part I: main features and storm track characteristics of the response. Journal of Climate 17,
857–876.
Massonnet
F.,
Fichefet
T.,
Goosse
H.,
Bitz
C.M.,
Philippon-Berthier
G.,
Holland
M.M.
&
Barriat
P.Y. 2012.
Constraining projections of summer Arctic sea ice. The Cryosphere Discussion 6,
2931–2959.
Publisher Full Text
Medeiros
B.,
Deser
C.,
Tomas
R.A.
&
Kay
J.E. 2011.
Arctic inversion strength in climate models. Journal of Climate 24,
4733–4740.
Publisher Full Text
Mikolajewicz
U.,
Sein
D.V.,
Jacob
D.,
Königk
T.,
Podzun
R.
&
Semmler
T. 2005.
Simulating Arctic sea ice variability with a coupled regional atmosphere–ocean–sea ice model. Meteorologische Zeitschrift 14,
793–800.
Publisher Full Text
Mironov
D.,
Heise
E.,
Kourzeneva
E.,
Ritter
B.,
Schneider
N.
&
Terzhevik
A. 2010.
Implementation of the lake parameterization scheme Flake into the numerical weather prediction model COSMO. Boreal Environment Research 15,
218–230.
Nikulin
G.,
Jones
C.,
Giorgi
F.,
Ashar
G.,
Buechner
M.,
Cerezo-Mota
R.,
Christensen
O.B.,
Deque
M.,
Fernandez
J.,
Hänsler
A.,
Van Meijgaard
E.,
Samuelsson
P.,
Sylla
M.B.
&
Sushama
L. 2012.
Precipitation climatology in an ensemble of CORDEX–Africa regional climate simulations. Journal of Climate 25,
6057–6078.
Publisher Full Text
Overland
J.E.
&
Wang
M. 2010.
Large-scale atmospheric circulation changes are associated with the recent loss of Arctic sea ice. Tellus Series A 62,
1–9.
Publisher Full Text
Petoukhov
V.
&
Semenov
V.A.
2010. A link between reduced Barents–Kara sea ice and cold winter extremes over northern continents. Journal of Geophysical Research—Atmospheres
115, D21111, doi: 10.1029/2009JD013568.
Publisher Full Text
Riihelä
A.,
Manninen
T.,
Laine
V.,
Andersson
K.
&
Kaspar
F. 2013.
CLARA-SAL: a global 28-yr timeseries of Earth's black-sky surface albedo. Atmospheric Chemistry and Physics 13,
3743–3762.
Publisher Full Text
Rinke
A.
&
Dethloff
K. 2008.
Simulated circum-Arctic climate changes by the end of the 21st century. Global and Planetary Change 62,
173–186.
Publisher Full Text
Rinke
A.,
Maslowski
W.,
Dethloff
K.
&
Clement
J.
2006. Influence of sea ice on the atmosphere: a study with an Arctic atmospheric regional climate model. Journal of Geophysical Research—Atmospheres
111, D16103, doi: 10.1029/2005JD006957.
Publisher Full Text
Samuelsson
P.,
Jones
C.G.,
Willen
U.,
Ullerstig
A.,
Gollvik
S.,
Hansson
U.,
Jansson
C.,
Kjellström
E.,
Nikulin
G.
&
Wyser
K. 2011.
The Rossby Centre regional model RCA3: model description and performance. Tellus Series A 63,
4–23.
Publisher Full Text
Screen
J.A.
&
Simmonds
I. 2010.
The central role of diminishing sea ice in recent Arctic temperature amplification. Nature 464,
1334–1337.
Publisher Full Text
Serreze
M.C.,
Barrett
A.P.,
Stroeve
J.C.,
Kindig
D.N.
&
Holland
M.M. 2009.
The emergence of surface-based Arctic amplification. The Cryosphere 3,
11–19.
Publisher Full Text
Serreze
M.C.,
Kahl
J.D.
&
Schnell
R.C. 1992.
Low-level temperature inversions of Eurasian Arctic and comparisons with Soviet drifting station data. Journal of Climate 5,
615–629.
Shkolnik
I.M.
&
Efimov
S.V.
2013. Cyclonic activity in high latitudes as simulated by a regional atmospheric model: added value and uncertainties. Environmental Research Letters
8, article no. 045007, doi: 10.1088/1748-9326/8/4/045007.
Publisher Full Text
Solomon
S.,
Qin
D.,
Manning
M.,
Chen
Z.,
Marquis
M.,
Averyt
K.B.,
Tignor
M.
&
Miller
H.L. Jr. (eds.) 2007. Climate change 2007. The physical science basis: contribution of Working Group I to the fourth assessment report of the Intergovernmental Panel on Climate Change.
Cambridge: Cambridge University Press.
Stone
D.A.
&
Weaver
A.J. 2003.
Factors contributing to diurnal temperature range trends in twentieth and twenty-first century simulations of the CCCma coupled model. Climate Dynamics 20,
435–445.
Stroeve
J.,
Holland
M.M.,
Meier
W.,
Scambos
T.
&
Serreze
M.
2007. Arctic sea ice decline: faster than forecast. Geophysical Research Letters
34, L09501, doi: 10.1029/2007/GL029703.
Publisher Full Text
Stroeve
J.C.,
Serreze
M.C.,
Holland
M.M.,
Kay
J.E.,
Malanik
J.
&
Barret
A.P. 2012.
The Arctic's rapidly shrinking sea ice cover: a research synthesis. Climatic Change 110,
1005–1027.
Publisher Full Text
Symon
C.,
Arris
L.
&
Heal
B. 2005. Arctic climate impact assessment. Cambridge: Cambridge University Press.
Tjernström
M.,
Zagar
M.,
Svensson
G.,
Cassano
J.J.,
Pfeiffer
S.,
Rinke
A.,
Wyser
K.,
Dethloff
K.,
Jones
C.,
Semmler
T.
&
Shaw
M. 2005.
Modelling the Arctic boundary layer: an evaluation of six ARCMIP regional-scale models using data from the SHEBA project. Boundary-Layer Meteorology 117,
337–381.
Publisher Full Text
Tuomenvirta
H.,
Alexandersson
H.,
Debs
A.,
Frich
P.
&
Nordli
P.O. 2000.
Trends in Nordic and Arctic temperature extremes and ranges. Journal of Climate 13,
977–990.
Unden
P.,
Rontu
L.,
Järvinen
H.,
Lynch
P.,
Calvo
J.,
Cats
G.,
Cuxart
J.,
Eerola
K.,
Fortelius
C.,
Garcia-Moya
J.A.,
Jones
C.,
Lenderlink
G.,
McDonald
A.,
McGrath
R.,
Navascues
B.,
Nielsen
N.W.,
Ødegaard
V.,
Rodriguez
E.,
Rummukainen
M.,
Rõõm
R.,
Sattler
K.,
Sass
B.H.,
Savijäarvi
H.,
Schreur
B.W.,
Sigg
R.,
The
H.
&
Tijm
A. 2002. HIRLAM-5 scientific documentation.
Norrköping: Swedish Meteorological and Hydrological Institute.
Uttal
T.,
Curry
J.A.,
Mcphee
M.G.,
Perovich
D.K.,
Moritz
R.E.,
Maslanik
J.A.,
Guest
P.S.,
Stern
H.L.,
Moore
J.A.,
Turenne
R.,
Heiberg
A.,
Serreze
M.C.,
Wylie
D.P.,
Persson
O.G.,
Paulson
C.A.,
Halle
C.,
Morison
J.H.,
Wheeler
P.A.,
Makshtas
A.
&
Welch
H. 2002.
Surface heat budget of the Arctic Ocean. Bulletin of the American Meteorological Society 83,
255–276.
Vavrus
S.,
Holland
M.,
Jahn
A.,
Bailey
D.
&
Blazey
B. 2012.
21st-century Arctic climate change in CCSM4. Journal of Climate 25,
2696–2710.
Publisher Full Text
Von Storch
H.
&
Zwiers
F.W. 1999. Statistical analysis in climate research.
Cambridge: Cambridge University Press.
Wang
M.
&
Overland
J.E.
2012. A sea ice free summer Arctic within 30 years: an update from CMIP5 models. Geophysical Research Letters
39, L18501, doi: 10.1029/2012GL052868.
Publisher Full Text
Yang
S.
&
Christensen
J.H.
2012. Arctic sea ice reduction and European cold winters in CMIP5 climate change experiments. Geophysical Research Letters
39, L20707, doi: 10.1029/2013GL0533338.
Publisher Full Text