RESEARCH ARTICLE
Freshwater input to the Arctic fjord Hornsund (Svalbard)
Małgorzata Błaszczyk1, Dariusz Ignatiuk1, Aleksander Uszczyk1, Katarzyna Cielecka-Nowak2, Mariusz Grabiec1, Jacek A. Jania1, Mateusz Moskalik3 & Waldemar Walczowski4
1Department of Geomorphology, Faculty of Earth Sciences, University of Silesia, Sosnowiec, Poland;
2Department of Climatology, Faculty of Earth Sciences, University of Silesia, Sosnowiec, Poland;
3Department of Polar and Marine Research, Institute of Geophysics, Polish Academy of Sciences, Warszawa, Poland;
4Physical Oceanography Department, Institute of Oceanology, Polish Academy of Sciences, Sopot, Poland
Abstract
Glaciers draining to the Hornsund basin (southern Spitsbergen, Svalbard) have experienced a significant retreat and mass volume loss over the last decades, increasing the input of freshwater into the fjord. An increase in freshwater input can influence fjord hydrology, hydrodynamics, sediment flux and biota, especially in a changing climate. Here, we describe the sources of freshwater supply to the fjord based on glaciological and meteorological data from the period 2006 to 2015. The average freshwater input from land to the Hornsund bay is calculated as 2517 ± 82 Mt a−1, with main contributions from glacier meltwater runoff (986 Mt a−1; 39%) and frontal ablation of tidewater glaciers (634 Mt a−1; 25%). Tidewater glaciers in Hornsund lose ca. 40% of their mass by frontal ablation. The terminus retreat component accounts for ca. 30% of the mass loss by frontal ablation, but it can vary between 17% and 44% depending on oceanological, meteorological and geomorphological factors. The contribution of the total precipitation over land excluding winter snowfall (520 Mt a−1), total precipitation over the fjord area (180 Mt a−1) and melting of the snow cover over unglaciated areas (197 Mt a−1) to the total freshwater input appear to be small: 21%, 7% and 8%, respectively.
Keywords
Svalbard fjords; frontal ablation; glacier meltwater runoff; precipitation; snow cover on land
Abbreviations
CTD: conductivity–temperature–depth instrument; DEM: digital elevation model; DLR EOC: Earth Observation Center, German Aerospace Center; IDEM: intermediate digital elevation model; Mt: megatonnes; m w.e.: metre water equivalent; SAR: Synthetic Aperture Radar; TSX: TerraSAR-X (an imaging radar Earth observation satellite); WGMS: World Glacier Monitoring Service, Department of Geography, University of Zurich
Citation: Polar Research 2019, 38, 3506, http://dx.doi.org/10.33265/polar.v38.3506
Copyright: Polar Research 2019. © 2019 M. Błaszczyk et al. This is an Open Access article distributed under the terms of the Creative Commons Attribution-NonCommercial 4.0 International License (http://creativecommons.org/licenses/by-nc/4.0/), permitting all non-commercial use, distribution, and reproduction in any medium, provided the original work is properly cited.
Published: 16 April 2019
Competing interests and funding: No potential conflict of interest was reported by the authors.
This paper presents some results from the project Arctic Climate System Study of Ocean, Sea Ice and Glaciers Interactions in Svalbard Area (Pol-Nor/198675/17/2013), supported by Poland’s National Centre for Research and Development under the framework of the Polish–Norwegian Research Cooperation Programme. Fieldwork was also supported by the funds of the European Science Foundation project Sensitivity of Svalbard Glaciers to Climate Change. The legacy from the Ice2sea 7th Framework Programme project was used. This project has received funding from the European Union’s Horizon 2020 research and innovation programme under grant agreement no. 727890. Bathymetric data were obtained under Polish Ministry of Science and Higher Education grant no. N N525 350038 and were purchased from the Norwegian Hydrographic Survey under National Science Centre project no. 2013/09/B/ST10/04141. The publication has been financed by the Leading National Research Centre (KNOW) funding received by the Centre for Polar Studies of the University of Silesia, Poland. MM was partially supported within statutory activities no. 3841/E-41/S/2018 of the Polish Ministry of Science and Higher Education.
Correspondence to: Małgorzata Błaszczyk, Faculty of Earth Sciences, University of Silesia, Bȩdzińska 60, PO-41-200 Sosnowiec, Poland; e-mail: malgorzata.blaszczyk@us.edu.pl
Introduction
The Arctic region has warmed significantly over the last century, with most of the increase occurring in the recent decades (Stocker et al. 2013). As a consequence, Svalbard glaciers have retreated significantly since the early 20th century, with mass loss and meltwater runoff increasing simultaneously (Hagen, Kohler et al. 2003; Kohler et al. 2007; Moholdt et al. 2010; Błaszczyk et al. 2013; Nuth et al. 2013; Ziaja & Ostafin 2015; Van Pelt & Kohler 2015; Aas et al. 2016; Małecki 2016; Østby et al. 2017; Grabiec et al. 2018). Freshwater from Svalbard glaciers have contributed to global sea-level rise by ca. 0.020–0.026 mm a−1 (Błaszczyk et al. 2009; Nuth et al. 2010). Although this is a small fraction of the global mean sea-level rise caused by all the glaciers of the world, the increased input of freshwater to the Svalbard fjords has a major local impact, altering fjord hydrology, hydrodynamics (Svendsen et al. 2002; Jakacki et al. 2017), sediment flux and biota (Wȩsławski et al. 1995; Lydersen et al. 2014; Moskalik et al. 2018). The cliffs of tidewater glaciers are especially important as feeding zones for seabirds (Urbański et al. 2017) and marine mammals (Lydersen et al. 2014). In addition, mass mortality of zooplankton communities frequently occurs as a consequence of freshwater and mineral matter outflow from glaciers (Wȩsławski & Legeżyńska 1998; Urbański et al. 2017).
This study assessed the average long-term (2006–2015) pattern of freshwater runoff to Hornsund fjord from its hydro-glaciological basin, taking into account the following components: (1) frontal ablation of tidewater glaciers; (2) glacier meltwater runoff calculated from the summer mass balance; (3) melting of seasonal snow cover from the unglaciated catchments; (4) runoff from the total precipitation over the entire basin; and (5) total precipitation over the fjord area. The purpose of this study is to calculate the total freshwater supply to the Arctic fjord (Hornsund), as well as to assess the contribution of the inflow from individual water sources listed above, based on in situ glaciological and meteorological data.
Study area
Hornsund is the southernmost fjord in Spitsbergen, on the west coast of the Svalbard Archipelago (Fig. 1). Its mouth lies between the distinct capes of Worcesterpynten, on the northern shore, and Palffyodden to the south. The morphometry of its hydro-glaciological basin for 2010 follows the data presented by Błaszczyk et al. (2013). The entire drainage basin area in 2010 amounted to ca. 1200 km2, of which ca. 67% (802 km2) was covered by glaciers. Around 65% of the total drainage to the Hornsund hydro-glaciological basin comes from 14 glaciers, representing 97% of the entire glaciated area (781 km2). Their areas vary from 1.8 km2 (Petersbreen) to 196.5 km2 (Storbreen). The total tidewater glacier cliff length in 2010 amounted to 34.7 km. The largest land-based glacier is Gåsbreen (10.2 km2); the remaining glaciers are less than 1.5 km2 each. The unglaciated parts of the catchment constitute 33% of the entire drainage basin. The area of the fjord in 2013 was around 311 km2, including the main basin (213 km2) and Brepollen (98 km2), which is in the inner part of the fjord and on the other side of a submerged sill from the main basin.

Fig. 1 Hornsund drainage basin, in southern Spitsbergen, Svalbard. The automatic weather station at the Polish Polar Station is indicated with an asterisk. Sofiebreen (S), Kvalfangarbreen (K), Wibebreen (W), Lorchbreen (L), Hyrnebreen (H), Signeybreen (Si) and Petersbreen (P) are small glaciers. The orange line near the weather station represents the location of the snow pit profiles over the unglaciated areas.
The air temperature in Hornsund has been increasing over the past decades, as well as for the entire Svalbard Archipelago (Førland et al. 2011; Van Pelt et al. 2016). The linear annual trend for Hornsund in the period 1979–2015 is +1.03°C per decade (Gjelten et al. 2016). The years 2000–2015 have been the warmest since the advent of instrumental records (Gjelten et al. 2016). The mean annual air temperature in the period 1979–2014 was −4.0°C (Osuch & Wawrzyniak 2017). The average total precipitation at the Polish Polar Station was 432.9 mm for the period 1979–2015, ranging from 230.2 mm in 1987 to 638.5 mm in 2006 (data from the OGIMET online weather information service at www.ogimet.com).
Hornsund is strongly influenced by cold Arctic Water from the Barents Sea. Shelf water mixes slowly with warmer Atlantic Water on the south-west shelf of Spitsbergen, forming strong density gradients that reduce the inflow of warm water into Hornsund compared to northern Spitsbergen fjords, which are more strongly influenced by warm Atlantic Water (Saloranta & Svendsen 2001; Promińska et al. 2017). Nevertheless, Hornsund underwent a gradual warming in 2001–2015 due to an increased presence of Atlantic Water (Promińska et al. 2017). Hornsund and the adjacent shelf are seasonally covered by multiyear ice transported around Sørkapp from the Barents Sea.
Data sources and methods
The freshwater runoff data included in this study were extracted from five different sources. Frontal ablation of tidewater glaciers (Af) was estimated in Mt, while glacier meltwater runoff was estimated from the summer mass balance—bs is point summer mass balance and Bs is glacier-wide summer mass balance—and is presented in m w.e. Melting of seasonal snow cover from the unglaciated catchments (QS) was estimated in m w.e., the runoff from the total precipitation over the entire basin (QTP(LAND)) was estimated for both glacier and land areas and expressed in millimeters. The estimated precipitation over the fjord (QTP(FJORD)) in all its forms (snow, liquid and drizzle) is given in millimeters. To enable the comparison between all the components, we present the results in two units: Mt and m w.e.
Although both frontal and surface summer ablation represent negative components of mass balance (Cogley et al. 2011), here the loss from the ice is known to be an equivalent gain for the ocean. Consequently, we use positive signs for all the analysed components.
The spatial variability of Bs, QS and QTP(LAND) calculations were based on surface height data from a DEM collected in 1990 (processed by the Norwegian Polar Institute [Nuth et al. 2010]), with glacier areas updated using the newest IDEM product (DLR EOC 2013). IDEM is an intermediate DEM based on TanDEM-X acquisitions from 2010 to 2012, available in three arcsec geographic coordinates.
Frontal ablation
Af represents glacier mass loss by calving, subaerial frontal melting and sublimation, and subaqueous frontal melting of the ice cliff (Cogley et al. 2011). Space-borne remote-sensing techniques are not capable of distinguishing between calving and melt; however, they can be used to estimate the total frontal ablation (Af) by adding the ice flux through a fluxgate near the calving front (qfg) and the mass change at the terminus below the fluxgate (qt) due to advance or retreat (Schellenberger et al. 2015), as follows:

where H is the ice thickness along the fluxgate, w is the width of the fluxgate, v is the velocity across the fluxgate and u is the advance/retreat rate averaged over the terminus area.
The average frontal ablation for the period 2006–2015 was estimated based on the velocity derived from the intensity tracking of repeat-pass TSX satellite radar images, bathymetry data and average changes in glacier terminus positions acquired from winter SAR data in 2006–2015. In addition, frontal ablation for the individual years 2014 and 2015 was estimated to illustrate how glacier extent changes can differ depending on whether warm or cold water flows into the fjord.
The accuracy of the frontal ablation estimate (σAf ) was evaluated based on the standard error calculated from the variance propagation law:
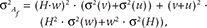
where σ(v), σ(u), σ(v) and σ(H) is the accuracy for each of the variables described above.
SAR offset tracking and validating the velocity data. A velocity map for the tidewater glaciers in Hornsund was derived from TSX images acquired using the Stripmap mode with ca. 2-m ground range pixel size (Fig. 2). Two pairs of scenes with 11 days of temporal resolution were processed: 15/12/2012–26/12/2012 for the western part of Hornsund and 23/02/2014–06/03/2014 for the central and eastern parts of the fjord. Displacement fields were obtained by offset tracking between two consecutive acquisitions processed with Gamma Remote Sensing software (Strozzi et al. 2002) and geocoded using the IDEM. The resolution of the final velocity map was 100 m, thus ice-front velocities were derived at 100 m resolution along the active glacier terminus. The accuracy of the TSX velocity map was estimated to be 30 m a−1 based on the median value of the calculation over land and the error from the smoothing of the velocity map.

Fig. 2 Hornsund bathymetry and glacier velocities derived from TSX during 15 to 26 December 2012 for the western part of Hornsund and 23 February to 6 March 2014 for the central and eastern parts of the fjord. Glacier front positions correspond to the end of 2006, 2014 and 2015. The red dots and capital letters indicate the position of the stakes measured by GPS and are used to validate the TSX velocity. The grey lines represent the location of the additional single beam depth measurements conducted during the summer campaigns.
Glacier velocity varies depending on the timescale considered (Benn & Evans 1998) and is mostly controlled by the distribution and pressure of water at the glacier bed (Lliboutry 1968; Müller & Iken 1973; Iken 1981; Willis 1995). Most glaciers flow faster during the ablation/melting season, as more meltwater results in increased sliding. Additional short-term peaks in velocity are also noted and are linked to ablation or large rainfall events (Müller & Iken 1973; Willis 1995; Benn & Evans 1998; Dunse et al. 2012; Luckman et al. 2015; Schellenberger et al. 2015; Van Pelt et al. 2018). Unfortunately, there is limited information regarding the variability of interannual velocity and the ratio of summer or winter velocity to the annual velocity of tidewater glaciers in Svalbard. Van Pelt et al. (2018) found that in Nordenskiöldbreen in central Svalbardthat average summer velocities increase with summer ablation, while velocities decrease in the subsequent fall seasons. However, according to the authors, the annual velocities of Nordenskiöldbeen are insensitive to summer ablation, which suggests a negligible impact of enhanced runoff on mean ice motion for this glacier. Strozzi et al. (2017) observed a steady increase in frontal velocity of Svalbard glaciers for 1994–2017.
To determine how representative the data on glacier velocity from Hornsund glaciers derived from winter SAR images are, compared to the annual velocities, we calculated the displacements of four stakes installed close to the front of three glaciers for 2013–15 (Fig. 2, Table 1). Although we do not have field and satellite data for the same period, these results help to understand how glacier speed changes seasonally. The ratio of winter to annual velocity varies between 81% and 105% (Table 1). In comparison, Dowdeswell et al. (2008) found that the winter differential interferometric SAR velocity data from Austfonna, north-eastern Svalbard, are on average 20% lower than the year-round field measurements. Based on Table 1, we assumed here that the TSX winter velocity field equals 90% of the mean annual velocity for tidewater glaciers in Hornsund. In addition, we discuss how using a 80%–100% winter to annual velocity ratio influences our frontal ablation estimates. We also analyse changes in frontal ablation if the interannual velocities deviated 20% from the TSX data used in our calculations.
Table 1 Glacier velocities derived from stake measurements (locations of stakes shown in Fig. 2) and winter TSX images.
| Glacier |
Stake |
Period of stake measurements |
Annual velocity |
TSX imageries |
Winter velocity based on TSX |
Ratio of winter/annual velocity |
| Hansbreen |
Za |
Aug. 2013–Aug. 2014 |
139 m a−1 |
Dec. 2012 |
113 m a−1 |
81% |
| Storbreen |
Rb |
Aug. 2013–Aug. 2014 |
19 m a−1 |
Feb. 2014 |
20 m a−1 |
105% |
| Hornbreen |
Tb |
Aug. 2014–Aug. 2015 |
70 m a−1 |
Feb. 2014 |
70 m a−1 |
100% |
| Hornbreen |
Ub |
Aug. 2014–Aug. 2015 |
460 m a−1 |
Feb. 2014 |
380 m a−1 |
83% |
| adGPS measurements with an accuracy of ±5 cm. bSingle-frequency GPS measurements with an accuracy ±5 m. |
Glacier velocity depends on depth, with the greatest values reached at the surface, where the cumulative effect of the strain in the underlying ice and sediments is the largest (Paterson 1981; Benn & Evans 1998). The ratio of basal to surface velocity for different glaciers varies from 0.1 to 0.9 (Paterson 1981; Cuffey & Paterson 2010). Schellenberger et al. (2015) calculated the frontal ablation of Kronebreen and Kongsbreen using a factor between 0.8 and 1.0. For Hansbreen, Jania (1988) suggested that basal sliding is responsible for 90–97% of the surface velocity based on calculations of internal deformation, while Vieli et al. (2004) proposed that this figure was ca. 90% of the superficial velocity. In our study, a depth-averaged speed factor of 0.9 was applied for velocities derived from TSX, although we also discuss the effect of using a 0.8–1.0 factor on the value obtained for frontal ablation.
We failed to retrieve velocity field data for four small tidewater glaciers because their velocities were lower than the accuracy of TSX data (<30 m a−1). Using optical images to track crevasses, Błaszczyk et al. (2009) showed that these glaciers were almost stagnant. We therefore assumed front velocities of 10 m a−1 for these glaciers (Table 2).
Table 2 Changes to the terminus positions and velocities averaged over the terminus width. Positive values of front fluctuations represent front advance.
| Glacier |
Average retreat 2006–2015 (m a−1) |
Fluctuations 2013–14 (m a−1) |
Fluctuations 2014–15 (m a−1) |
Average velocity (m a−1) |
| Hansbreen |
−56 |
−133 |
87 |
177 |
| Paierlbreen |
−98 |
−287 |
79 |
450 |
| Mühlbacherbreen |
−116 |
−31 |
79 |
414 |
| Kvalfangarbreena |
−10 |
|
|
10 |
| Wibebreena |
0 |
|
|
10 |
| Hyrnebreena |
−10 |
|
|
10 |
| Storbreen |
−225 |
−328 |
−225 |
132 |
| Hornbreen |
−89 |
−15 |
131 |
287 |
| Svalisbreen |
−58 |
9 |
8 |
201 |
| Mendelejevbreen |
−239 |
−325 |
−18 |
123 |
| Chomjakovbreena |
−46 |
|
|
50 |
| Samarinbreen |
−66 |
−156 |
−35 |
113 |
| Petersbreena |
−10 |
|
|
10 |
| Körberbreena |
−19 |
|
|
51 |
| aSmall and stagnant glaciers for which the multiannual front changes are below the accuracy of front delimitation from satellite data. |
Ice thickness (bathymetry and cliff height). Bathymetry data in Hornsund were collected by the Norwegian Hydrographic Service using a single beam survey during 1992–94 and using a multi-beam survey during 2007–08 for selected bays (Hansbukta and Burgerbukta). Later measurements were collected by the Institute of Geophysics Polish Academy of Sciences, using both single beam and multi-beam profiling in Brepollen during 2007–08 and 2009 (Moskalik et al. 2013) and using multi-beam profiling at the Hansbreen front in 2015. In addition, to determine sea depth at the glacier fronts as accurately as possible, we used single echo-sounding data collected during summer by the University of Silesia and the Institute of Oceanology between 2010 and 2015 (Fig. 2).
Tidewater glaciers in the Hornsund basin were in retreat during the study period, so a continuous topographic map of the bedrock from the glacier front was not available for this study. Glacier depths were acquired from the closest bathymetry data available (Fig. 2) at 100 m resolution along the cliff. A constant valley shape has been assumed along the line of retreat. We argue that this approach is more accurate than assuming a constant sea depth as previously used to estimate frontal ablation (Hagen, Melvold et al. 2003; Błaszczyk et al. 2009).
The elevation and geometry of Hansbreen’s calving front above sea level was surveyed using a precise laser scanner in 2009 and 2015, showing average cliff heights of 35 ± 10 m and 43 ± 10 m, respectively. Similarly to earlier studies (Hagen, Melvold et al. 2003; Błaszczyk et al. 2009; Schellenberger et al. 2015), we assumed 40 ± 15 m as the approximate cliff height for all tidewater glaciers in Hornsund. Glacier ice thickness was calculated as the sum of the underwater cliff depth derived from bathymetry data and the assumed height of the ice-face above sea level.
Changes in the position of the glacier terminus. Accurate determination of frontal ablation requires consideration of seasonal fluctuations of tidewater glacier fronts (Jania 1988; Mansell et al. 2012). In particular, it is important to take into account that Svalbard glaciers reach their minimum extent in winter and that the amplitude of the seasonal changes can be significantly larger than their average long-term retreat (Błaszczyk et al. 2013; Luckman et al. 2015; Schellenberger et al. 2015). Correctly identifying the minimum frontal position is especially important when comparing the variability in calving flux over two consecutive years. In this study, the minimum glacier extent was based on SAR data—from ERS-2, Envisat, ALOS TSX and Sentinel-1 satellites—acquired during the winter seasons between 2006 and 2015. Following previous studies (Howat et al. 2008; Błaszczyk et al. 2013; Schild & Hamilton 2013), the glacier retreat was averaged over the terminus width. The accuracy of the determination of the glacier front position based on satellite data was evaluated using terrestrial data from Hansbreen cliff locations obtained using a Garmin GMR 18HD panoramic radar and a Riegl FG21-LR laser distance ranger. The estimated accuracy for the glacier front fluctuation data was ±30 m.
We also present changes in the terminus position in 2013–14, when significant retreat was observed for most of the glaciers in the fjord, and changes for the period 2014–15, when these glaciers advanced in relation to their previous year position or their retreat was much lower than average.
Glacier meltwater runoff
To estimate glacier meltwater runoff, we use the summer mass balance data for Hansbreen available from the WGMS. There is a difference between the summer mass balance (Bs), which includes summer mass gain and loss, and the summer ablation (As), which excludes mass gain. Here we use Bs because of data availability. Comparison of Bs (Fig. 1, for six ablation seasons) with As measured by a SR50 sensor (Campbell Scientific) on Hansbreen shows a difference between Bs and As below 5%. Nevertheless, the difference between Bs and As (potential summer accumulation from snow precipitation) has been taken into account in estimating the total precipitation over land (QTP(LAND)) during summer (June–September). Bs in the Hornsund area was calculated using summer mass balance data measured at 11 ablation stakes on Hansbreen (bs) between 2006 and 2015 (Fig. 1, WGMS). WGMS data provide, among others, information about point and spatial accumulation and ablation on glaciers. Data from 2013 were deemed unreliable for being far outside the summer mass balance range of other Svalbard glaciers. The summer balance (Bs) was estimated by extrapolation of stakes data (bs) covering different representative elevations (Cogley et al. 2011).
The relationship between Bs on Hansbreen and elevation (Fig. 3) allows estimating average Bs for glaciers in the drainage basin of Hornsund (R2 = 0.97):

Fig. 3 Summer mass balance (Bs) of Hansbreen from 2006 to 2015 (thin lines) and average summer Bs for Hansbreen (boldface lines). Point summer mass balance on Flatbreen and Storbreen for the years 2013–14 and 2014–15 are shown as black dots. The vertical bars represent standard deviation. Data source: WGMS.

The error was estimated using the total differential function:

where H represents the elevation and σ
H
is the DEM accuracy (±5 m).
The calculated Bs for Hansbreen varies from 63 to 84 Mt a−1 for the analysed period, with an average value of 71 Mt a−1 (Fig. 3). Using the multiannual average relation between summer mass balance and elevation (above sea level) for Hansbreen, we estimated Bs for Flatbreen and Storbreen for the 2013–14 and 2014–15 seasons. The validation of this calculation was based on point summer mass balance (bs) data from six ablation stakes located on Storbreen and Flatbreen between 2013 and 2015 (Figs. 1, 3). The results of Bs for Flatbreen and Storbreen based on direct measurements (254 ± 30 Mt a−1 for 2013–14 and 289 ± 34 Mt a−1 for 2014–15) follow the Bs calculated on the basis of Hansbreen data (225 ± 47 Mt a−1 for 2013–14 and 257 ± 28 Mt a−1 for 2014–15). The mass balance derived from direct measurements was slightly higher than that modelled based on Hansbreen data alone, possibly as a consequence of insufficient direct data from highly elevated areas (where measuring stakes were damaged) and the significant deviation of the data recorded on one of the lowest ablation stakes in relation to the overall results (Fig. 3). Nonetheless, the general agreement between Bs calculated using different approaches allowed us to apply the relationship between Hansbreen summer mass balance and elevation above sea level to all the glaciers in the Hornsund drainage basin.
Runoff from snowmelt and precipitation
Melting of seasonal snow cover in unglaciated catchments. QS was estimated based on snow cover depth measurements conducted near the Polish Polar Station between 2006 and 2015 and a DEM. In addition, continuous measurements of snow depth and density changes with altitude were taken during the 2012/13 winter season (Fig. 1). These observations served as the basis to calculate the lapse rate of snow depth (0.15 m w.e. per 100 m−1) and the average snow density (350 kg m−3). The influence of slope inclination on snow depth was defined, after Kirnbauer et al. (1991) and Lehning et al. (2011), as follows:
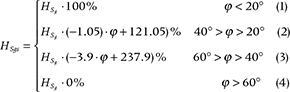
The error was estimated using the total differential function:
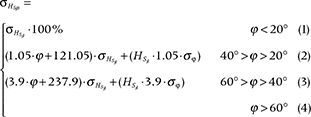
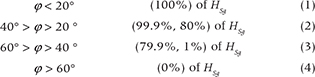
where HSg represents snow depth, j slope inclination, HSgs snow depth taking slope function into account, and σj are the accuracies of HSgs and j, respectively. Equations (1) to (4) correspond to the relationship between HSg and j :
We assumed that the snow cover over unglaciated areas melts in its entirety during summer, contributing to the input of freshwater into the fjord. This is consistent with our yearly field observations at the end of the melting season.
Runoff from total precipitation. Total precipitation over the fjord (QTP(FJORD)) and over land (QTP(LAND)) were considered as the freshwater input from precipitation. However, for QTP(LAND), snow precipitation is neglected for the period October–May, as meltwater from snow is already taken into account in Bs and QS. QTP(FJORD) and QTP(LAND) were determined based on the total annual average precipitation measured at the Polish Polar Station in Hornsund during the period 2006–2015 and extrapolated using a DEM for Hornsund. Precipitation estimations were based on daily total precipitation data and records of meteorological phenomena (classification containing a division on liquid, mixed and solid precipitation) from the Hornsund automatic weather station (Fig. 1) located at 77°11’N, 17°33’E (8 m a.s.l.). These data were retrieved from the OGIMET database, the archives of the Institute of Geophysics Polish Academy of Sciences and the Hornsund meteorological yearbooks for the period 2006–2015. Average daily air temperature and surface elevation were taken into account as an additional criterion to determine precipitation types. Days with liquid (rain or/and drizzle), mixed precipitation (rain with snow or sleet) and solid precipitation (snow) were identified based on temperature and the occurrence of above-mentioned precipitation types. A precipitation day refers to the 24-hr period from 06:00 AM UTC. Analyses were performed on annual (January–December) and seasonal timescales. To calculate QTP, we used a precipitation gradient of 19% per 100 m for rainfalls and snowfalls, following previous studies in the Norwegian Arctic (Killingtveit 2004; Nowak & Hodson 2013). Precipitation data were corrected for catching error, using correction values of 1.15 for liquid and 1.65 for solid precipitation (Nowak & Hodson 2013). Regarding mixed precipitation, the correction factor was 1.4, as the average of the above values.
The average annual liquid precipitation for 2006–2015 measured at the Polish Polar Station in Hornsund was 213.2 mm (with standard deviation 70.7 mm), while the mean annual solid precipitation was 164.0 mm (standard deviation 39.8 mm). These precipitation values were used as reference to calculate the precipitation gradient and amount of freshwater input to Hornsund. Combining the total precipitation at the reference site, the precipitation gradient and a DEM allowed us to obtain the spatial distribution of the precipitation over the studied area.
The spatial distribution of the precipitation (QTP) was determined using an elevation-dependent function:

The error was estimated using the total differential function, as follows:

where PRECPPS represents the precipitation at the Polish Polar Station, ΔPREC is the gradient of precipitation equalled 0.19%/1 m (Nowak & Hodson 2013), H the elevation, σH is DEM accuracy (±5 m) and σPRECPPS is the accuracy of the precipitation measurements at the Polish Polar Station.
Results
Frontal ablation
The minimum glacier front position for Hornsund glaciers and the changes that the glaciers experienced in their extent for the period 2006–2015 are shown in Fig. 2 and Table 2. The ice flux results (Af) are shown in Tables 3 and 4 and Fig. 4. We also present specific frontal ablation data (Fig. 5a), to measure water supply in relation to the glacier area. The ratio of Af to Bs is presented in Fig. 6. The average long-term frontal ablation rate for all the tidewater glaciers in Hornsund for the period 2006–2015 was 634 ± 59 Mt a−1, of which 435 Mt a−1 (69%) was lost through ice flux (qfg) and 199 Mt a−1 (31%) through terminus retreat (qt). In 2014, qt increased to ca. 44% because of an extreme reduction of the glacier front area during this year. On the other hand, qt was only around 1% in 2015 if all the glaciers in the fjord were considered, or 17% if only the retreating ones were included in the calculations. For six small tidewater glaciers, the change in their annual front position was lower than the measurement accuracy, so they were not included in estimates of annual frontal ablation for the period 2013–15. The average long-term frontal ablation of these small glaciers was 9.4 Mt a−1, corresponding to about 1.5% of the total frontal ablation in Hornsund. As a consequence, multiannual changes can be neglected in these cases.
Table 3 Components of glacially originated freshwater input to the Hornsund basin: total frontal ablation of tidewater glaciers in Hornsund (Af) including ice flux (qfg) and terminus position changes (qt), error of estimation (ΔAf), percentage in comparison to the total frontal ablation of all the tidewater glaciers (%Af), glacier meltwater runoff calculated from the summer mass balance (Bs; including data from land-based glaciers), error of estimation (ΔBs), proportion of meltwater runoff to the runoff from all the tidewater glaciers in Hornsund (%Bs).
| Glacier |
qfg (Mta−1) |
qt (Mta−1) |
Af (Mta−1) (m w.e. a−1) |
ΔAf (Mta−1) (m w.e. a−1) |
%Af |
Bs (Mta−1) (m w.e. a−1) |
ΔBs (Mta−1) (m w.e. a−1) |
%Bs |
| Hansbreen |
27.1 |
7.8 |
34.9 (0.652) |
10.3 (0.193) |
6 |
71 (1.328) |
8 (0.146) |
7 |
| Paierlbreen |
123.6 |
23.3 |
146.9 (1.407) |
22.7 (0.217) |
23 |
107 (1.025) |
12 (0.113) |
11 |
| Mühlbacherbreen |
74.7 |
19.4 |
94.1 (1.910) |
18.7 (0.380) |
15 |
46 (0.934) |
5 (0.103) |
5 |
| Kvalfangarbreen |
0.4 |
0.9 |
1.3 (0.099) |
1.4 (0.107) |
<1 |
18 (1.374) |
2 (0.151) |
2 |
| Wibebreen |
0.3 |
0.0 |
0.3 (0.052) |
1.1 (0.193) |
<1 |
7 (1.225) |
1 (0.135) |
1 |
| Hyrnebren |
0.3 |
0.3 |
0.5 (0.117) |
0.9 (0.176) |
<1 |
8 (1.563) |
1 (0.172) |
1 |
| Storbreen |
35.9 |
60.1 |
96.0 (0.493) |
29.3 (0.151) |
15 |
260 (1.336) |
29 (0.147) |
27 |
| Hornbreen |
87.1 |
24.1 |
111.2 (0.647) |
29.9 (0.174) |
18 |
227 (1.320) |
25 (0.145) |
24 |
| Svalisbreen |
20.6 |
5.6 |
26.2 (0.862) |
9.0 (0.296) |
4 |
47 (1.546) |
5 (0.170) |
5 |
| Mendelejevbreen |
17.5 |
30.7 |
48.1 (1.626) |
14.4 (0.487) |
8 |
47 (1.588) |
5 (0.175) |
5 |
| Chomjakovbreen |
1.6 |
1.4 |
3.0 (0.227) |
1.8 (0.136) |
<1 |
16 (1.211) |
2 (0.133) |
2 |
| Samarinbreen |
42.8 |
24.1 |
66.9 (0.804) |
22 (0.264) |
11 |
97 (1.165) |
11 (0.128) |
10 |
| Petersbreen |
0.1 |
0.1 |
0.2 (0.110) |
0.3 (0.165) |
<1 |
2 (1250) |
0.2 (0.130) |
<1 |
| Körberbreen |
3.0 |
1.1 |
4.1 (0.452) |
3.0 (0.334) |
1 |
11 (1.224) |
1 (0.135) |
1 |
| Land-based glaciers |
– |
– |
– |
– |
– |
22 (1.038) |
3 (0.115) |
– |
Table 4 Components of terrestrial runoff into Hornsund and precipitation over the fjord.
| Component |
|
Freshwater input (Mta−1) |
Δ Freshwater input (Mta−1) |
Percentage of total input (%) |
| Af |
Frontal ablation |
634 |
59a |
25 |
| Bs |
Meltwater runoff |
986 |
43a |
39 |
| QS |
Snow cover from the unglaciated catchments |
197 |
24b |
8 |
| QTP(LAND) |
Runoff from the total precipitation over the entire basin (except winter snowfall) |
520 |
26b |
21 |
| QTP(FJORD) |
Total precipitation over the fjord area |
180 |
9b |
7 |
| Sum |
|
2517 |
82a |
100 |
| aΔ is the error estimated as the square-root of the summed squared contributions. bΔ is the error estimated as total differential function. |

Fig. 4 Frontal ablation of tidewater glaciers in Hornsund (Af) and its components: ice-flow through a defined flux gate (qfg) and mass changes at the terminus below the flux gate (qt). In addition, qt for the maximum retreat measured during the 2014 season and the minimum retreat measured during the 2015 season are presented.

Fig. 5 Average annual freshwater input into Hornsund for the period 2006–2015: (a) specific frontal ablation (Af); (b) specific glacier meltwater runoff (Bs); (c) melting of seasonal snow cover from the unglaciated catchments (QS); (d) runoff from total precipitation over the entire basin (QTP(LAND)) and over the fjord area (QTP(FJORD)). The black dashed line represents the division between the main Hornsund basin and Brepollen.

Fig. 6 Freshwater input into Hornsund from each individual contributor: (a) total input (Mt); (b) specific input (m w.e.). The contribution from frontal ablation and glacier meltwater runoff is also presented for the tidewater glaciers.
On a decadal scale, 81% of the freshwater from frontal ablation stems from the five largest tidewater glaciers: Paierlbreen, Mühlbacherbreen, Hornbreen, Storbreen and Samarinbreen (515 Mt a−1). The main frontal ablation component for Paierlbreen, Mühlbacherbreen and Hornbreen is ice flux through a fluxgate (qfg). This follows the fact that these glaciers are the most dynamic in the region. In the case of Storbreen, which surged in the 1960s, and Mendelejevbreen surging between 1997 and 2002 (Sund et al. 2011), the majority of the mass loss relates to a considerable front retreat (qt).
Glacier meltwater derived from the summer mass balance
The total Bs was 986 ± 43 Mt a−1 (Tables 3, 4). Specific glacier meltwater runoff is presented in Fig. 5b. Surface melting of tidewater and land-based glaciers is responsible for 98% and 2% of the meltwater, respectively. The relationship between the dimensions of the glacier and the quantity of meltwater produced is clearly visible (Fig. 6). The three largest glaciers, Hornbreen (Flatbreen), Storbreen and Paierlbreen, occupy more than 61% of the glaciated area and are responsible for the production of 62% of the freshwater from surface melting. Only Mühlbacherbreen, despite its large surface area, shows lower surface ablation as the majority of its area is situated relatively high above sea level.
Runoff from solid and liquid precipitation
Figures 5c and 6 and Table 4 show the snow cover field estimated over the unglaciated area of the Hornsund basin. The spatial mean QS were estimated at 197 ± 24 Mt a−1 (0.5 m w.e. a−1). Coastal areas received snow up to 0.71 m depth (0.25 m w.e.). Highly elevated areas received more snowfall, although the steep slopes frequently occurring in southern Spitsbergen significantly contribute to the reduction of snow cover depth. In relatively flat areas, like the upper part of Čebyševfjellet, the modelled snow cover depth reached more than 4 m (1.5 m w.e.).
The highest annual total liquid precipitation measured at the Hornsund meteorological station during the study period was 287.1 mm (2006) and the lowest was 80.0 mm (2007), resulting in an interannual amplitude of 207.1 mm. Above-average rainfalls were also recorded in 2010 (228.2 mm), 2011 (284.0 mm) and 2015 (231.8 mm). Across all seasons, most of the liquid precipitation occurs in autumn (September–November) and summer (June–August), with 97.6 mm and 64.9 mm on average for each period, respectively. Considering the months individually, the highest monthly liquid precipitation was observed in September (61.2 mm on average).
Based on these data, QTP(LAND) for 2006–2015 was 520 ± 26 Mt a−1 (Figs. 5d, 6, Table 4). This estimation was based on the input of rainwater over land and glaciers for January–May (42 Mt a−1) and October–December (86 Mt a−1) and the total liquid, solid and mixed precipitation measured during the ablation season (June–September, 392 Mt a−1). The freshwater input from all precipitation types (liquid, mixed and solid) estimated over the sea surface of the fjord (QTP(FJORD)) was 180 ± 9 Mt a−1.
Total freshwater input to Hornsund
The estimated total freshwater runoff to Hornsund was 2517 ± 82 Mt a−1 (2006–2015). These results reveal that Bs and Af are the major sources of freshwater to the fjord, contributing 39% and 25%, respectively. In addition, 21% of the freshwater input comes from QTP(LAND) (excluding solid precipitation for January–May and October–December), 7% from QTP(FJORD) and 8% from QS.
The large tidewater glaciers are the main source of freshwater for the studied region (Fig. 6, Table 4). Specific Bs (Fig. 6b) is highly correlated (r = 0.99) to the area/altitude distribution. On the other hand, the correlation between specific Af and glacier area is slightly weaker (r = 0.81), depending also on other factors such as glacier dynamics or front retreat. The ratio between Af and Bs varies with the front velocity, surge history and glacier morphometry. In the case of the fast-flowing and fast retreating Paierlbreen, most of the freshwater comes from Af. In the case of Storbreen, a glacier that surged in the 1930s (based on geomorphic observations and aerial photographs taken in 1936, available at https://toposvalbard.npolar.no/), the mass loss strongly depends on the large ablation area of this glacier. Despite the substantial front retreat most of the water discharge for Storbreen comes from Bs. For Mühlbacherbreen, mass loss occurs predominantly by Af compared to Bs because of the larger relative extent of the accumulation zone.
Discussion
General characteristic of the freshwater input
The mean annual runoff from all the sources to Hornsund for the period 2006–2015 (2517 Mt) is twice the runoff of 1127 Mt estimated by Jania & Pulina (1996) or the 1376 Mt reported for Kongsfjorden, a fjord basin north of Spitsbergen and slightly larger than Hornsund (Svendsen et al. 2002). Differences in the study periods and increases in temperature (Gjelten et al. 2016), precipitation (Osuch & Wawrzyniak 2017) and glacier retreat (Carr et al. 2017) recorded in both areas over the recent decades could explain the differences in estimated runoff. The lower runoff estimates for Kongsfjorden can also be related to its geographical location, as the northern parts of Svalbard are colder and drier than Hornsund (Gjelten et al. 2016; Osuch & Wawrzyniak 2017). Nevertheless, our results confirm previous findings that the dominant source of freshwater to Spitsbergen fjords are glaciers (e.g., Wȩsławski et al. 1995; Beszczynska-Möller et al. 1997; Svendsen et al. 2002; MacLachlan et al. 2007). Precipitation (QTP) is the second most important component, while freshwater runoff from snowmelt from ice-free areas (QS) is much lower than that from other sources both for Hornsund and Kongsfjorden (Svendsen et al. 2002).
The total freshwater input to the fjord in Brepollen is slightly higher than to the main Hornsund basin. Approximately 52% of the runoff supplies Brepollen (1318 Mt), while 48% goes into the main basin (1199 Mt). The freshwater input to Brepollen is similar to the 1312.9 Mt a−1 compiled by Wȩsławski et al. (1995) from data collected in 1987–88 and 1992–94. Although their results consider a significantly larger area of glaciers, which retreated significantly afterwards, a warming trend (Gjelten et al. 2016; Van Pelt et al. 2016) may have caused a compensating increase in freshwater runoff.
On average, an equivalent of 9% of the fjord volume is discharged into Hornsund as freshwater runoff every year. However, this percentage changes from basin to basin, being higher for Brepollen (22%) than for the main Hornsund basin (5%). Converting the freshwater volume to a layer of freshwater distributed uniformly over the fjord area, this would be equivalent to a surface layer 8.1 m thick. For the individual basins, the thickness of this freshwater layer would be 13.4 m for Brepollen and 5.6 m for the main basin. These results are consistent with high-resolution CTD measurements collected during the AREX Arctic expeditions of the RV Oceania. The water salinity measured in Brepollen at the end of July for 2001–2015 was lower than that from the main basin (Promińska et al. 2017). Note that the freshwater input varies seasonally and annually. According to Wȩsławski et al. (1991), the proportion of freshwater in Hornsund fjord was 3.2% in August 1987, but only 0.56% in 1996 (Beszczynska-Möller et al. 1997).
The volume of runoff just from glaciers (Af and Bs) is also higher for Brepollen (55%) than for the main fjord basin (45%), mainly because of the presence of larger tidewater glaciers within the Brepollen area. However, if only Af is considered, the highest contribution is measured at the main basin (55%) compared to the Brepollen area (45%), mainly because of the intense calving activity of Paierlbreen.
Af represents 40% of the total annual mass loss from tidewater glaciers in Hornsund, which is a significant component of the overall mass balance. Compare this to the ca. 32% that Błaszczyk et al. (2009) estimated for all Svalbard tidewater glaciers. The results for Hornsund are slightly higher than those reported for Austfonna, where the calving flux represents approximately 33% of annual mass loss (Dowdeswell et al. 2008). The lower ratio of frontal ablation to total mass loss for Austfonna can be caused by lower glacier velocities and rate of retreat for the tidewater glaciers (Dowdeswell et al. 2008) and lower temperatures (Przybylak et al. 2014), compared to Hornsund. Note, however, that Dowdeswell et al. (2008) use data collected over an earlier period (1960–1990s), and the ratio of frontal ablation to total mass loss might have changed for Austfonna following the recent surge of Basin 3 (Dunse et al. 2015).
Freshwater runoff components
We have presented here the first Af estimation for Hornsund based on detailed bathymetry and velocity maps, the latter validated with GPS stake measurements, and taking into account annual fluctuations related to the minimum glacier cliff extent in December–January. Svalbard glaciers typically exhibit seasonal and yearly differences in glacier velocity (Sund et al. 2014; Dunse et al. 2015; Luckman et al. 2015; Schellenberger et al. 2015; Strozzi et al. 2016; Strozzi et al. 2017; Van Pelt et al. 2018), although most of the continuous velocity observations available come from faster flowing and surging glaciers. Despite the increasing volume of SAR data and the ease of access to satellite images, the availability of data with the appropriate spatial and temporal resolution to derive velocity for glaciers in southern Svalbard for every year is still limited. Speckle and offset tracking is an efficient methodology to evaluate glacier velocity over Svalbard (Dunse et al. 2015; Luckman et al. 2015; Schellenberger et al. 2016; Strozzi et al. 2016; Strozzi et al. 2017), although it also has some drawbacks. Firstly, the time periods when high-resolution SAR images are available are restricted, and secondly, gaps and errors appear on surface velocity maps, especially for slow-flowing areas. On account of bad data co-registration, Schellenberger et al. (2016) did not estimate velocity from Radarsat-2 data acquired during the 2012/13 winter over the southern part of Spitsbergen. The authors concluded that it is generally more difficult to derive glacier velocities using offset tracking methods in Svalbard than for other glacier regions such as the Canadian Arctic, because of the number of rain events occurring year round which influence surface properties. Here, we assumed that the velocity data used in the study are representative values for the overall period (2006–2015) as they were validated with in situ velocity data near the glacier fronts, which are not available for any other surging or fast-flowing glacier on Svalbard. If we assume that glacier velocity deviates 20% from the average TSX velocity, the estimated Af would differ by approximately 14% (±87 Mt a−1) from the long-term average value. Furthermore, if the 80%–100% ratio of winter to annual velocity and the 0.8–1.0 ratio of basal to surface velocity were taken into account, the estimations of the frontal ablation would be 14% lower (547 Mt a−1) or 17% higher (742 Mt a−1) compared to the long-term average value.
Our results on Af are currently the best possible approximation of the freshwater delivery to the fjord due to cliff retreat. The terminus retreat component (qt) in Hornsund is responsible for ca. 30% of the total frontal ablation, although the multiyear variations ranged between 17% and 44% on account of the strong variability of observed glacier front positions. Variations in glacier front retreat observed in 2014 and 2015 could relate to water temperature. According to summer sea temperature surveys in Hornsund conducted during 2001–2015, July 2014 was the warmest month recorded, with the water temperature 1.5°C higher than the period average (Promińska et al. 2017). The position of tidewater glacier termini is controlled by a variety of factors, including water temperature, water depth, submarine geomorphology, sedimentation, ice flux into the terminus, air temperature influencing surface melting and rate of calving, and surge history (Meier & Post 1969, 1987; Vieli et al. 2002; Motyka et al. 2003; Bartholomaus et al. 2013; O’Leary & Christoffersen 2013; Dowdeswell et al. 2015). It is therefore important to remember that our results for the freshwater input to the fjord due to Af are a long-term average.
The Af estimated here (0.63 Mt a−1) is almost twice as large as that previously calculated (0.33 Mta−1; Błaszczyk et al. 2009), as glacier velocities and retreat are much larger than the values assumed in that previous study, where the velocity and retreat data were from a different period (2001–06). This difference is also caused by the lower accuracy of the data used in the previous study. Błaszczyk et al. (2009) made a few assumptions for estimation of frontal ablation, such as a uniform glacier height (100 m) and the use of frontal crevassing for glacier velocity estimation. Especially the latter component is likely to have caused underestimation of the frontal ablation.
It is difficult to compare our Af results with those from other areas. Direct Af observations in Svalbard are scarce and focussed mainly on Austfonna and fast-flowing or surging glaciers. The first calculations of total glacier ice flux in Svalbard yielded 4 ± 1 Gt a−1 (Hagen, Melvold et al. 2003) and 6.75 ± 1.7 Gt a−1 (Błaszczyk et al. 2009). However, a single surging or fast-flowing glacier in Svalbard can calve at the rate of 0.2–4.2 Gt a−1 (Sund et al. 2014; Dunse et al. 2015; Strozzi et al. 2016), significantly contributing to the total calving-related mass loss in Svalbard. Our results show that the frontal ablation of tidewater glaciers in Hornsund (0.63 Gt) is small compared to surging and fast-flowing glaciers (e.g., 15% of iceberg discharge from surging Basin-3, Austfonna ice cap, as estimated by Dunse et al. [2015]) and to the whole of Svalbard (ca. 9% of the total glacier ice flux estimated by Błaszczyk et al. [2013]). Nevertheless, at the regional level, Hornsund glaciers supply approximately 65% more water to the fjord than Kronebreen and Kongsbreen to Kongsfjorden, as estimated by Schellenberger et al. (2015). Unfortunately, there are not enough data to compare Hornsund to other fjords in Svalbard.
The modelled Bs for glaciers in Hornsund basin varies from 0.934 m w.e. (Mühlbacherbreen) to 1.588 m w.e. (Mendelejevbreen) and strongly depends on glacier hypsometry. The mean Bs calculated here was 1.275 ± 0.140 m w.e., which follows the surface melt model for southern Spitsbergen reported by Aas et al. (2016), where Bs was estimated as 1.350 ± 0.315 m w.e.
Factors such as elevation, slope, aspect, wind, atmospheric circulation or landforms can influence snow distribution; therefore, accurately estimating the volume of QS over the unglaciated area remains a complex task. Lacking data for several of these factors, we used only elevation and slope as the main parameters determining snow depth. Elevation is widely considered as the main factor controlling snow distribution (Marchand & Killingtveit 2001; Lehning et al. 2011; Grünewald et al. 2014). Grabiec et al. (2011) and Laska et al. (2017) estimated a snow accumulation gradient of ca. 0.25 m w.e. 100 m−1 for Hansbreen, confirming the higher values in southern Spitsbergen compared to the average for Svalbard (0.097 m w.e. 100 m−1), as described by Winther et al. (2003). Potential errors arising from extrapolation and determining precipitation type make estimations of precipitation and terrestrial melting uncertain.
On a multiannual scale, the input of freshwater from each of the components in individual years may significantly deviate from the average. Note also that our analysis does not include data of land-fast ice melting. From our observations, land-fast ice cover at the front of tidewater glaciers only occurs during winter and spring. Moreover, the formation and melting of the ice-pack can influence seasonal salinity, but they do not change the total volume of freshwater discharged into the fjord annually. Only ice-pack brought in from the Barents Sea could slightly influence water salinity in the fjord, although the volume of ice that can thus be advected into Hornsund remains unclear. Any potentially negligible contribution of deep circulation karst ground waters has been also excluded from this study. Regarding the melting of icebergs, based on our longstanding field experience, we suggest that most of the icebergs and ice brash produced through calving melt within the fjord during the summer and fall.
Temporal trends in freshwater supply
According to Enderlin et al. (2014), observations from Greenland support recent model projections indicating that surface mass balance, rather than ice dynamics, will dominate the ice sheet’s contribution to sea-level rise expected over the 21st century. Within the Hornsund drainage system, both components are important for glacier mass loss. The recession rate of tidewater glaciers in Hornsund has increased nearly threefold from the first decades of the 20th century up to 2001–2010 (Błaszczyk et al. 2013). In addition, an increase in frontal velocity along with a retreat of the frontal positions over the whole Svalbard was reported by Strozzi et al. (2017). The research by Nowak & Hodson (2013) in the Bayelva catchment (Kongsfjorden, Svalbard) for the 1975–2010 period also shows that during the last eight years precipitation events have been more frequent, and more often in liquid form during May, September and October. Further acceleration of glacier retreat and increases in surface ablation and precipitation are also expected in the near future because of ongoing and projected climatic change (Førland et al. 2011; Stocker et al. 2013; Osuch & Wawrzyniak 2016). Further research is needed to identify the seasonal and multiannual input from all the components, in the light of contemporary ice–ocean–atmosphere interactions.
Conclusions
So far, little work has been carried out on freshwater input to Svalbard fjords. Here, we present the first long-term average estimations of freshwater supply to Hornsund, taking into account all the significant sources. Combining in situ records with satellite and meteorological data from 2006–2015, we found that glaciers are the main contributors of freshwater to the fjord (64%). Frontal ablation represents 40% of the total annual mass loss from tidewater glaciers in Hornsund, which is a more significant component of the overall mass balance than was found in earlier studies. Remaining non-glacial sources of freshwater (precipitation over unglaciated areas and the fjord itself) are minor suppliers of water to the fjord.
Hornsund receives more freshwater than Kongsfjorden, which is located 2 degrees to the north. This can be explained by different climatic conditions; however, the pattern of contribution from individual freshwater sources is similar in both fjords. We believe that the structure found in Hornsund – with freshwater of glacial origin predominating, and meteoric precipitation over unglaciated areas and the fjord as the secondary source – may be valid for most Svalbard fjord catchments.
The freshwater input to Hornsund reflects the recent climate warming trend. This study has shown that freshwater runoff to the fjord has doubled compared to calculations from the 1970–1990s. Recent trends and future climate-change scenarios indicate that absolute values of freshwater input to the fjord will further increase in the next few decades.
Acknowledgements
ERS-2 SAR, Envisat and ALOS images were provided by European Space Agency (project no. C1P.9630) and TSX data by the DLR (project LAN2787). Sentinel-1 came from Copernicus Sentinel data (2014–2016), and IDEM was provided by the DLR under proposal IDEM_METH0107. MB thanks Anna Barańska for her valuable help. We also wish to express our gratitude to the winter crews of the Polish Polar Station in Hornsund for maintenance of the glacier monitoring system and assistance during field campaigns. The authors are very grateful to two anonymous reviewers and the subject editor for useful comments that helped to improve the manuscript.
References
Aas K.S., Dunse T., Collier E., Schuler T.V., Berntsen T.K., Kohler J. & Luks B. 2016. The climatic mass balance of Svalbard glaciers: a 10-year simulation with a coupled atmosphere–glacier mass balance model. The Cryosphere 10, 1089–1104, http://dx.doi.org/10.5194/tc-10-1089-2016.
Bartholomaus T.C., Larsen C.F. & O’Neel S. 2013. Does calving matter? Evidence for significant submarine melt. Earth and Planetary Science Letters 380, 21–30, http://dx.doi.org/10.1016/j.epsl.2013.08.014.
Benn D.I. & Evans D.J.A. 1998. Glaciers and glaciation. London: Arnold.
Beszczynska-Möller A., Wȩsławski J.W., Walczowski W. & Zajączkowski M. 1997. Estimation of glacial meltwater discharge into Svalbard coastal waters. Oceanologia 39, 289–299.
Błaszczyk M., Jania J.A. & Hagen J.O. 2009. Tidewater glaciers of Svalbard: recent changes and estimates of calving fluxes. Polish Polar Research 30, 85–142.
Błaszczyk M., Jania J.A. & Kolondra L. 2013. Fluctuations of tidewater glaciers in Hornsund Fiord (southern Svalbard) since the beginning of the 20th century. Polish Polar Research 34, 327–352. http://dx.doi.org/10.2478/popore-2013-0024.
Carr J.R., Stokes C.R. & Vieli A. 2017. Threefold increase in marine-terminating outlet glacier retreat rates across the Atlantic Arctic: 1992–2010. Annals of Glaciology 58(74), 72–91, http://dx.doi.org/10.1017/aog.2017.3.
Cogley J.G., Hock R., Rasmussen L.A., Arendt A.A., Bauder A., Braithwaite R.J., Jansson P., Kaser G., Möller M., Nicholson L. & Zemp M. 2011. Glossary of glacier mass balance and related terms. Paris: United Nations Educational, Scientific and Cultural Organization, International Hydrological Programme.
Cuffey K.M. & Paterson W.S.B. 2010. The physics of glaciers. Amsterdam: Academic Press.
DLR EOC 2013. TanDEM-X ground segment DEM products specification document, Issue 3.0. Weßling: Earth Observation Center, German Aerospace Center. Accessed on the internet at http://elib.dlr.de/108014/1/TD-GS-PS-0021_DEM-Product-Specification_v3.1.pdf on 15 November 2016.
Dowdeswell J.A., Benham T.J., Strozzi T. & Hagen J.O. 2008. Iceberg calving flux and mass balance of the Austfonna ice cap on Nordaustlandet, Svalbard. Journal of Geophysical Research—Earth Surface 113, F03022, http://dx.doi.org/10.1029/2007JF000905.
Dowdeswell J.A., Hogan K.A., Arnold N.S., Mugford R.I., Wells M., Hirst J.P.P. & Decalf C. 2015. Sediment-rich meltwater plumes and ice-proximal fans at the margins of modern and ancient tidewater glaciers: observations and modeling. Sedimentology 62, 1665–1692, http://dx.doi.org/10.1111/sed.12198.
Dunse T., Schellenberger T., Hagen J.O., Kääb A., Schuler T.V. & Reijmer C.H. 2015. Glacier-surge mechanisms promoted by a hydro-thermodynamic feedback to summer melt. The Cryosphere 9, 197–215, http://dx.doi.org/10.5194/tc-9-197-2015.
Dunse T., Schuler T.V., Hagen J.O. & Reijmer C.H. 2012. Seasonal speed-up of two outlet glaciers of Austfonna, Svalbard, inferred from continuous GPS measurements. The Cryosphere 6, 453–466, http://dx.doi.org/10.5194/tc-6-453-2012.
Enderlin E.M., Howat I.M., Jeong S., Noh M.J., Angelen J.H. & Broeke M.R. 2014. An improved mass budget for the Greenland ice sheet. Geophysical Research Letters 41, 866–872, http://dx.doi.org/10.1002/2013GL059010.
Førland E.J., Benestad R., Hanssen-Bauer I., Haugen J.E. & Skaugen T.E. 2011. Temperature and precipitation development at Svalbard 1900–2100. Advances in Meteorology 2011, article no. 893790, http://dx.doi.org/10.1155/2011/893790.
Gjelten H.M., Nordli Ø., Isaksen K., Førland E., Sviashchennikov P., Wyszyński P., Prokhorova U., Przybylak R., Ivanov B. & Urazgildeeva A. 2016. Air temperature variations and gradients along the coast and fjords of western Spitsbergen. Polar Research 35, article no. 29878, http://dx.doi.org/10.3402/polar.v35.29878.
Grabiec M., Ignatiuk D., Jania J.A., Moskalik M., Głowacki P., Błaszczyk M., Budzik T. & Walczowski W. 2018. Coast formation in an Arctic area due to glacier surge and retreat: the Hornbreen–Hambergbreen case from Spitsbergen. Earth Surface Processes and Landforms 43, 387–400, http://dx.doi.org/10.1002/esp.4251.
Grabiec M., Puczko D., Budzik T. & Gajek G. 2011. Snow distribution patterns on Svalbard glaciers derived from radio-echo soundings. Polish Polar Research 32, 393–421, http://dx.doi.org/10.2478/v10183-011-0026-4.
Grünewald T., Bühler Y. & Lehning M. 2014. Elevation dependency of mountain snow depth. The Cryosphere 8, 2381–2394, http://dx.doi.org/10.5194/tc-8-2381-2014.
Hagen J.O., Kohler J., Melvold K. & Winther J.G. 2003. Glaciers in Svalbard: mass balance, runoff and freshwater flux. Polar Research 22, 145–159, http://dx.doi.org/10.1111/j.1751-8369.2003.tb00104.x.
Hagen J.O., Melvold K., Pinglot F. & Dowdeswell J.A. 2003. On the net mass balance of the glaciers and ice caps in Svalbard, Norwegian Arctic. Arctic, Antarctic, and Alpine Research 35, 264–270. http://dx.doi.org/10.1657/1523-0430(2003)035[0264:OTNMBO]2.0.CO;2.
Howat I.M., Joughin I., Fahnestock M., Smith B.E. & Scambos T. 2008. Synchronous retreat and acceleration of southeast Greenland outlet glaciers 2000–2006: ice dynamics and coupling to climate. Journal of Glaciology 54, 646–660, http://dx.doi.org/10.3189/002214308786570908.
Iken A. 1981. The effect of the subglacial water pressure on the sliding velocity of a glacier in an idealized numerical model. Journal of Glaciology 27, 407–421, http://dx.doi.org/10.3189/S0022143000011448.
Jakacki J., Przyborska A., Kosecki S., Sundfjord A. & Albretsen J. 2017. Modelling of the Svalbard fjord Hornsund. Oceanologia 59, 473–495, http://dx.doi.org/10.1016/j.oceano.2017.04.004.
Jania J. 1988. Dynamiczne procesy glacjalne na południowym Spitsbergenie (w s’wietle badań fotointerpretacyjnych i fotogrametrycznych). (Dynamic glacial processes in south Spitsbergen [in light of photo interpretation and photogrammetric research].) Katowice: Wydawnictwo Uniwersytetu S´ląskiego.
Jania J. & Pulina M. 1996. Polish hydrological studies in Spitsbergen, Svalbard: a review of some results. In K. Sand & Å. Killingtveit (eds.): Proceedings. Tenth International Northern Research Basins Symposium and Workshop, Norway 1994. Pp. 47–76. Trondheim: SINTEF Norwegian Hydrotechnical Laboratory.
Killingtveit Å. 2004. Water balance studies in two catchments on Spitsbergen. In D.L. Kane & D. Yang (eds.): Northern research basins water balance. Proceedings of a workshop held at Victoria, Canada, March 2004. IAHS Publishing 290. Pp. 120–128. Wallingford: International Association of Hydrological Sciences Press.
Kirnbauer R., Blöschl G., Waldhäusl P. & Hochstöger F. 1991. An analysis of snow cover patterns as derived from oblique aerial photographs. In H. Bergmann et al. (eds.): Snow, hydrology and forests in high alpine areas. Vol. 205. Pp. 91–99. Wallingford: International Association of Hydrological Sciences Press.
Kohler J., James T.D., Murray T., Nuth C., Brandt O., Barrand N.E., Aas H.F. & Luckman A. 2007. Acceleration in thinning rate on western Svalbard glaciers. Geophysical Research Letters 34(18), L18502, http://dx.doi.org/10.1029/2007GL030681.
Laska M., Grabiec M., Ignatiuk D. & Budzik T. 2017. Snow deposition patterns on southern Spitsbergen glaciers, Svalbard, in relation to recent meteorological conditions and local topography. Geografiska Annaler Series A 99, 262–287, http://dx.doi.org/10.1080/04353676.2017.1327321.
Lehning M., Grünewald T. & Schirmer M. 2011. Mountain snow distribution governed by an altitudinal gradient and terrain roughness. Geophysical Research Letters 38(19), L19504, http://dx.doi.org/10.1029/2011GL048927.
Lliboutry L. 1968. General theory of subglacial cavitation and sliding of temperate glaciers. Journal of Glaciology 7(49), 21–58, http://dx.doi.org/10.1017/S0022143000020396.
Luckman A., Benn D.I., Cottier F., Bevan S., Nilsen F. & Inall M. 2015. Calving rates at tidewater glaciers vary strongly with ocean temperature. Nature Communication 6, article no. 8566, http://dx.doi.org/10.1038/ncomms9566.
Lydersen C., Philipp A., Stig F.-P., Kohler J., Kovacs K.M., Reigstad M., Steen H., Strøm H., Sundfjord A., Varpe Ø., Walczowski W., Weslawski J.M. & Zajaczkowski M. 2014. The importance of tidewater glaciers for marine mammals and seabirds in Svalbard, Norway. Journal of Marine Systems 129, 452–471, http://dx.doi.org/10.1016/j.jmarsys.2013.09.006.
MacLachlan S.E., Cottier F.R., Austin W.E. & Howe J.A. 2007. The salinity: δ18O water relationship in Kongsfjorden, western Spitsbergen. Polar Research 26, 160–167, http://dx.doi.org/10.1111/j.1751-8369.2007.00016.x.
Małecki J. 2016. Accelerating retreat and high-elevation thinning of glaciers in central Spitsbergen. The Cryosphere 10, 1317–1329, http://dx.doi.org/10.5194/tc-10-1317-2016.
Mansell D., Luckman A. & Murray T. 2012. Dynamics of tidewater surge-type glaciers in northwest Svalbard. Journal of Glaciology 58, 110–118, http://dx.doi.org/10.3189/2012JoG11J058.
Marchand W.D. & Killingtveit Å. 2001. Analyses of the relation between spatial snow distribution and terrain characteristics. In: Proceedings of the 58th Eastern Snow Conference. Pp. 14–17. Ottawa: American Geophysical Union, American Water Resources Association.
Meier M.F. & Post A.S. 1969. What are glacier surges? Canadian Journal of Earth Sciences 6, 807–817, http://dx.doi.org/10.1139/e69-081.
Meier M.F. & Post A.S. 1987. Fast tidewater glaciers. Journal of Geophysical Research 92—Solid Earch and Planets 92, 9051–9058, http://dx.doi.org/10.1029/JB092iB09p09051.
Moholdt G., Hagen J.O., Eiken T. & Schuler T.V. 2010. Geometric changes and mass balance of the Austfonna ice cap, Svalbard. The Cryosphere 4, 21–34, http://dx.doi.org/10.5194/tc-4-21-2010.
Moskalik M., Ćwiąkała J., Szczuciński W., Dominiczak A., Głowacki O., Wojtysiak K. & Zagórski P. 2018. Spatiotemporal changes in the concentration and composition of suspended particulate matter in front of Hansbreen, a tidewater glacier in Svalbard. Oceanologia 60, 446–463, http://dx.doi.org/10.1016/j.oceano.2018.03.001.
Moskalik M., Grabowiecki P., Tȩgowski J. & Żulichowska M. 2013. Bathymetry and geographical regionalization of Brepollen (Hornsund, Spitsbergen) based on bathymetric profiles interpolations. Polish Polar Research 34, 1–22, http://dx.doi.org/10.2478/popore-2013-0001.
Motyka R.J., Hunter L., Echelmeyer K.A. & Connor C. 2003. Submarine melting at the terminus of a temperate tidewater glacier, LeConte Glacier, Alaska, USA. Annals of Glaciology 36, 57–65, http://dx.doi.org/10.3189/172756403781816374.
Müller F. & Iken A. 1973. Velocity fluctuations and water regime of Arctic valley glaciers. International Association of Scientific Hydrology Publication 95, 165–182.
Nowak A. & Hodson A. 2013. Hydrological response of a High-Arctic catchment to changing climate over the past 35 years: a case study of Bayelva watershed, Svalbard. Polar Research 32, article no. 19691, http://dx.doi.org/10.3402/polar.v32i0.19691.
Nuth C., Kohler J., König M., von Deschwanden A., Hagen J.O., Kääb A., Moholdt G. & Pettersson R. 2013. Decadal changes from a multi-temporal glacier inventory of Svalbard. The Cryosphere 7, 1603–1621, http://dx.doi.org/10.5194/tc-7-1603-2013.
Nuth C., Moholdt G., Kohler J., Hagen J.O. & Kääb A. 2010. Svalbard glacier elevation changes and contribution to sea level rise. Journal of Geophysical Research 115, F01008, http://dx.doi.org/10.1029/2008JF001223.
O’Leary M. & Christoffersen P. 2013. Calving on tidewater glaciers amplified by submarine frontal melting. The Cryosphere 7, 119–128, http://dx.doi.org/10.5194/tc-7-119-2013.
Østby T.I., Schuler T.V., Hagen J.O., Hock R., Kohler J. & Reijmer C.H. 2017. Diagnosing the decline in climatic mass balance of glaciers in Svalbard over 1957–2014. The Cryosphere 11, 191–215, http://dx.doi.org/10.5194/tc-11-191-2017.
Osuch M. & Wawrzyniak T. 2016. Climate projections in the Hornsund area, southern Spitsbergen. Polish Polar Research 37, 379–402, http://dx.doi.org/10.1515/popore-2016-0020.
Osuch M. & Wawrzyniak T. 2017. Inter- and intra-annual changes in air temperature and precipitation in western Spitsbergen. International Journal of Climatology 37, 3082–3097, http://dx.doi.org/10.1002/joc.4901.
Paterson W.B.S. 1981. The physics of glaciers. Oxford: Pergamon Press.
Promińska A., Cisek M. & Walczowski W. 2017. Kongsfjorden and Hornsund hydrography—comparative study based on a multiyear survey in fjords of west Spitsbergen. Oceanologia 59, 397–412, http://dx.doi.org/10.1016/j.oceano.2017.07.003.
Przybylak R., Araźny A., Nordli Ø., Finkelnburg R., Kejna M., Budzik, T., Migała K., Sikora S., Puczko D., Rymer K. & Rachlewicz G. 2014. Spatial distribution of air temperature on Svalbard during 1 year with campaign measurements. International Journal of Climatology 34, 3702–3719, http://dx.doi.org/10.1002/joc.3937.
Saloranta T. & Svendsen H. 2001. Across the Arctic Front west of Spitsbergen: high resolution CTD sections from 1998–2000. Polar Research 20, 177–184, http://dx.doi.org/10.1111/j.1751-8369.2001.tb00054.x.
Schellenberger T., Dunse T., Kääb A., Kohler J. & Reijmer C.H. 2015. Surface speed and frontal ablation of Kronebreen and Kongsbreen, NW Svalbard, from SAR offset tracking. The Cryosphere 9, 2339–2355, http://dx.doi.org/10.5194/tc-9-2339-2015.
Schellenberger T., Van Wychen W., Copland L., Kääb A. & Gray L. 2016. An inter-comparison of techniques for determining velocities of maritime Arctic glaciers, Svalbard, using Radarsat-2 wide fine mode data. Remote Sensing 8(99), article no. 785, http://dx.doi.org/10.3390/rs8090785/.
Schild K.M. & Hamilton G.S. 2013. Seasonal variations of outlet glacier terminus position in Greenland. Journal of Glaciology 59, 759–770, http://dx.doi.org/10.3189/2013JoG12J238.
Stocker T.F., Qin D., Plattner G.-K., Tignor M., Allen S.K., Boschung J., Nauels A., Xia Y., Bex V. & Midgley P.M. (eds.) 2013. Climate change 2013. The physical science basis. Contribution of Working Group I to the fifth assessment report of the Intergovernmental Panel on Climate Change. Cambridge and New York: Cambridge University Press.
Strozzi T., Kääb A. & Schellenberger T. 2016. Frontal destabilization of Stonebreen, Edgeøya, Svalbard. The Cryosphere 11, 553–566, http://dx.doi.org/10.5194/tc-11-553-2017.
Strozzi T., Luckman A., Murray T., Wegmüller U. & Werner C.L. 2002. Glacier motion estimation using SAR offset-tracking procedures. IEEE Transactions on Geoscience and Remote Sensing 40, 2384–2391, http://dx.doi.org/10.1109/TGRS.2002.805079.
Strozzi T., Paul F., Wiesmann A., Schellenberger T. & Kääb A. 2017. Circum-Arctic changes in the flow of glaciers and ice caps from satellite SAR data between the 1990s and 2017. Remote Sensing 9, article no. 947, http://dx.doi.org/10.3390/rs9090947
Sund M., Błaszczyk M., Eiken T. & Jania J.A. 2011. The implications of surge and tidewater glacier dynamics related to climate change response of Svalbard glaciers. In M. Sund (ed.): On the dynamics of surge−type and tidewater glaciers in Svalbard. PhD thesis, Faculty of Mathematics and Natural Sciences, University of Oslo, no. 1147.
Sund M., Lauknes T.R. & Eiken T. 2014. Surge dynamics in the Nathorstbreen glacier system, Svalbard. The Cryosphere 8, 623–638, http://dx.doi.org/10.5194/tc-8-623-2014.
Svendsen H., Beszczynska-Møller A., Hagen J.O., Lefauconnier B., Tverberg V., Gerland S., Ørbøk J.B., Bischof K., Papucci C., Zajaczkowski M., Azzolini R., Bruland O., Wiencke C., Winther J.G. & Dallmann W. 2002. The physical environment of Kongsfjorden–Krossfjorden, an Arctic fjord system in Svalbard. Polar Research 21, 133–166, http://dx.doi.org/10.1111/j.1751-8369.2002.tb00072.x.
Urbański J.A., Stempniewicz L., Wȩsławski J.M, Dragańska-Deja K., Wochna A, Goc M. & Iliszko L. 2017. Subglacial discharges create fluctuating foraging hotspots for sea birds in tidewater glacier bays. Nature Scientific Reports 7, article no. 43999, http://dx.doi.org/10.1038/srep43999.
Van Pelt W.J.J. & Kohler J. 2015. Modelling the long-term mass balance and firn evolution of glaciers around Kongsfjorden, Svalbard. Journal of Glaciology 61, 731–744, http://dx.doi.org/10.3189/2015JoG14J223.
Van Pelt W.J.J., Kohler J., Liston G.E., Hagen J.O., Luks B., Reijmer C.H. & Pohjola V.A. 2016. Multidecadal climate and seasonal snow conditions in Svalbard. Journal of Geophysical Research—Earth Surface 121, 2100–2117, http://dx.doi.org/10.1002/2016JF003999.
Van Pelt W.J.J., Pohjola V.A., Pettersson R., Ehwald L.E., Reijmer C.H., Boot W.& Jakobs C.L. 2018. Dynamic response of a High Arctic glacier to melt and runoff variations. Geophysical Research Letters 45, 4917–4926, http://dx.doi.org/10.1029/2018GL077252.
Vieli A., Jania J., Blatter H. & Funk M. 2004. Short-term velocity variations on Hansbreen, a tidewater glacier in Spitsbergen. Journal of Glaciology 50, 389–398, http://dx.doi.org/10.3189/172756504781829963.
Vieli A., Jania J. & Kolondra L. 2002. The retreat of a tidewater glacier: observations and model calculations on Hansbreen, Spitsbergen. Journal of Glaciology 48, 592–600, http://dx.doi.org/10.3189/172756502781831089.
Wȩsławski J.M., Jankowski A., Kwas’niewski S., Swerpel S. & Ryg M. 1991. Summer hydrology and zooplankton in two Svalbard fjords. Polish Polar Research 12, 445–460.
Wȩsławski J.M., Koszteyn J., Zajączkowski M., Wiktor J. & Kwas’niewski S. 1995. Fresh water in Svalbard fjord ecosystems. In H.R. Skjoldal et al. (eds.): Ecology of fjords and coastal waters. Pp. 229–242. Amsterdam: Elsevier Science.
Wȩsławski J.M. & Legeżyńska J. 1998. Glaciers caused zooplankton mortality? Journal of Plankton Research 20, 1233–1240, http://dx.doi.org/10.1093/plankt/20.7.1233.
Willis I.C. 1995. Intra-annual variations in glacier motions: a review. Progress in Physical Geography 19, 61–106, http://dx.doi.org/10.1177/030913339501900104.
Winther J.G., Bruland O., Sand K., Gerland S., Marechal D., Ivanov B., Głowacki P. & König M. 2003. Snow research in Svalbard—an overview. Polar Research 22, 125–144, http://dx.doi.org/10.1111/j.1751-8369.2003.tb00103.x.
Ziaja W. & Ostafin K. 2015. Landscape-seascape dynamics in the isthmus between Sørkapp Land and the rest of Spitsbergen: will a new big Arctic island form? Ambio 44, 332–342, http://dx.doi.org/10.1007/s13280-014-0572-1.