RESEARCH ARTICLE
Groundwater discharge to the western Antarctic coastal ocean
Kimberly A. Null1, D. Reide Corbett1,2, Jared Crenshaw2, Richard N. Peterson3, Leigha E. Peterson3 & W. Berry Lyons4
1Institute for Coastal Science and Policy, East Carolina University, Greenville, NC, USA;
2Department of Geological Sciences, East Carolina University, Greenville, NC, USA;
3Department of Coastal and Marine Systems Science, Coastal Carolina University, Conway, SC, USA;
4Byrd Polar and Climate Research Center, Ohio State University, Columbus, OH, USA
Abstract
Submarine groundwater discharge (SGD) measurements have been limited along the Antarctic coast, although groundwater discharge is becoming recognized as an important process in the Antarctic. Quantifying this meltwater pathway is important for hydrologic budgets, ice mass balances and solute delivery to the coastal ocean. Here, we estimate the combined discharge of subglacial and submarine groundwater to the Antarctic coastal ocean. SGD, including subglacial and submarine groundwater, is quantified along the WAP at the Marr Glacier terminus using the activities of naturally occurring radium isotopes (223Ra, 224Ra). Estimated SGD fluxes from a 224Ra mass balance ranged from (0.41 ± 0.14)×104 and (8.2 ± 2.3)×104m3 d−1. Using a salinity mass balance, we estimate SGD contributes up to 32% of the total freshwater to the coastal environment near Palmer Station. This study suggests that a large portion of the melting glacier may be infiltrating into the bedrock and being discharged to coastal waters along the WAP. Meltwater infiltrating as groundwater at glacier termini is an important solute delivery mechanism to the nearshore environment that can influence biological productivity. More importantly, quantifying this meltwater pathway may be worthy of attention when predicting future impacts of climate change on retreat of tidewater glaciers.
Keywords
Groundwater; subglacial meltwater; western Antarctic Peninsula; radium
Abbreviations
AH: Arthur Harbor; CTD: conductivity–temperature–depth instrument; MDA: minimum detectable activity; P8: Point 8; RaDecc: Radium Delayed Coincidence Counter; SGD: submarine groundwater discharge; WAP: western Antarctic Peninsula
Citation: Citation: Polar Research 2019, 38, 3497, http://dx.doi.org/10.33265/polar.v38.3497
Copyright: Polar Research 2019. © 2019 K.A. Null et al. This is an Open Access article distributed under the terms of the Creative Commons Attribution-NonCommercial 4.0 International License (http://creativecommons.org/licenses/by-nc/4.0/), permitting all non-commercial use, distribution, and reproduction in any medium, provided the original work is properly cited.
Published: 04 April 2019
Competing interests and funding: No potential conflict of interest was reported by the authors.
This project was funded by National Science Foundation grants to DRC and KAN (PLR-1142090) and to WBL (PLR-1142059).
Correspondence to: Kimberly Null, Moss Landing Marine Laboratories, 8272 Moss Landing Road, Moss Landing, CA 95039, USA. E-mail: knull@mlml.calstate.edu
To access the supplementary material, please visit the article landing page
Introduction
Groundwater discharge has been recognized as an important process at the land–sea interface worldwide (Burnett et al. 2006; Moore 2010; and references therein). This process in coastal environments has been defined as SGD and includes all water, terrestrially derived freshwater and recirculated seawater crossing the sediment–water interface regardless of driving mechanism (Burnett et al. 2003; Michael et al. 2005; Taniguchi et al. 2006). Submarine groundwater can transport chemical constituents from land and seafloor sediments to coastal waters and therefore plays an important role in coastal geochemical budgets and ecosystem dynamics (e.g., Corbett et al. 1999; Slomp & Van Cappellen 2004; Paytan et al. 2006; de Sieyes et al. 2008; Knee et al. 2010; Beusen et al. 2013). SGD and the associated chemical flux are spatially and temporally variable, and consequently the impacts of SGD on water quality and ecology are site-specific (Taniguchi et al. 2002; Moore 2010). Groundwater discharge measurements, especially discharge to the ocean, have been limited along the Antarctic coast, although groundwater is becoming recognized as an important process in the Antarctic (Lyons et al. 2005; Uemura et al. 2011; Christoffersen et al. 2014; Bartholomaus et al. 2015). Uemura et al. (2011) measured direct rates of SGD using automated seepage meters in Lützow-Holm Bay, East Antarctica, that were greater than those found at similar depths (60–665 m) in more temperate environments. Those direct measurements of SGD along the Antarctic continental shelf highlight a previously unidentified flow path of meltwater to coastal waters and highlight the need for further investigations to quantify flow and nutrient contributions. Quantifying this meltwater pathway is important for hydrologic budgets, ice mass balances and understanding the impact of climate change on glacier retreat and hydrologic processes.
A vast majority of marine glaciers (e.g., tidewater and ice shelf glaciers) along the Antarctic Peninsula have been rapidly retreating since their earliest known positions in about 1953 (Cook et al. 2005; Rignot et al. 2005; Cook et al. 2016). Many details of these retreating glaciers remain to be studied, such as the mode of freshwater delivery and associated solute fluxes, as well as impacts on geochemical budgets within coastal ecosystems. Freshwater delivery from glaciers and ice shelves along the WAP is important because it plays a role in water column stratification (Dierssen et al. 2002). Moreover, salinity and phytoplankton biomass display an inverse relationship along the WAP (Dierssen et al. 2002), demonstrating the importance of freshwater inputs to phytoplankton succession (Garibotti et al. 2003). The volume of SGD to the Antarctic nearshore ecosystem is possibly less than other freshwater inputs, such as glacier calving, but quantifying discharge occurring along glacier termini can provide valuable insight about hydrologic processes involving total meltwater volume, subsurface flow paths and glacier dynamics.
We examine SGD along the WAP at the Marr Glacier terminus using the activities of naturally occurring radium isotopes (223Ra, 224Ra). Radium isotopes are recognized as valuable geochemical tracers of SGD in coastal environments because they are considerably elevated in brackish to saline groundwater compared to surface water (e.g., Moore 1996, 2010; Charetteet al. 2001; Burnett & Dulaiova 2003). Here, the introduction of SGD in the Antarctic also includes subglacial discharge occurring at a tidewater glacier terminus. Subglacial meltwater between the glacier and bedrock has been found to have significant water–rock interaction and solute acquisition and therefore can be similar to groundwater composition (Brown et al. 1996; Hodgkins et al. 1997; Hodson et al. 2010). For this study, we assume that SGD and subglacial discharge have similar chemical composition at our study site and that SGD cannot be discerned independently from subglacial discharge. Therefore, SGD includes subglacial discharge occurring at the base of the glacier, diffuse surface runoff in contact with rock, fresh groundwater and recirculated seawater. We further calculate the recirculated seawater portion of SGD to account for only freshwater SGD.
Methods
Study site and sampling
Field studies during the 2012/13 and 2013/14 austral summers were conducted at the terminus of the Marr Glacier at two different locations near Palmer Station, AH, and P8 (Fig. 1). The Marr Glacier on Anvers Island has retreated by approximately 300 m in the last five decades, and new land is exposed annually (Rejcek 2014), indicating an increase in meltwater delivery to the coastal ocean. A preliminary tracer survey was conducted during the austral summer of 2012/13, with more intensive sampling nearshore during 2013/14. Each nearshore sampling event consisted of a total of 9–12 discrete surface (ca. 1 m below surface) and subsurface samples (ca. 1 m above bottom) from three or four sites across the nearshore zone (extending up to 100 m offshore). Water depth changed from ca. 1.5 m depth near shore to ca. 32 m depth at AH and 18 m depth at P8. Groundwater samples were collected from two locations using a custom drive-point piezometer lined with Teflon tubing and peristaltic pump. Marine water and groundwater samples from all sites were measured for conductivity, salinity (calculated from conductivity), temperature (YSI 85 multi-probe; Yellow Springs Instruments) and short-lived radium isotopes (223Ra, 224Ra). Nearshore water samples were collected approximately weekly over eight weeks and across a range of tidal cycles at each site, with groundwater samples collected up to three times at each site during the field campaign. Large-volume ice samples were collected in the field and transported to the station for melting under controlled conditions before Ra measurements.

Fig. 1 (a) Sampling locations along Anvers Island during austral summers 2012/13 and 2013/14. AH and P8 were the focus sampling sites during 2014. Black triangles indicate surface samples in AH, and white triangles represent surface samples at P8. White circles are groundwater-fed stream samples. Grey circles are groundwater samples. The plus symbol is the ice sample location. White squares represent samples outside the coastal box. The size of the coastal box for the mass balance model is demonstrated by the highlighted line along the coastline and encompassing the farthest surface samples as the outer edge of the box. Inset shows location along WAP. (b) Photograph of AH, the terminating glacier face and the steep, rocky terrain from the retreated glacier terminus. (c) Photograph of P8 showing lower sloping terrain to the coastal ocean.
Groundwater, ice and nearshore surface water samples (20 L for groundwater, 50 L for melted ice and 150 L each nearshore sample) were collected using pumps (except ice) and passed through MnO2-coated acrylic fibre at a flow rate <2 L min−1 to quantitatively scavenge dissolved Ra isotopes (Moore & Reid 1973). Plain acrylic fibre was placed before the MnO2-coated fibre in the cartridge to act as a prefilter. The fibres were analysed immediately after collection for 223Ra and 224Ra activities using a RaDeCC (Moore & Arnold 1996) and counted for 8–10 hr on average. The sample fibres were analysed a second time more than four weeks after collection to measure 228Th and correct for supported 224Ra (Moore & Arnold 1996). The detectors were calibrated to community-distributed Mn-fibre standards prepared from National Institute of Standards and Technology standards for the GEOTRACES programme. The analytical error based on counting statistics of the samples analysed via the RaDeCC system averaged 7% and 27% for 224Ra and 223Ra, respectively, following calculations from Garcia-Solsona et al. (2008). The MDA was derived using the blank count rate, detector efficiency, count time and the sample volume (Currie 1968; Garcia-Solsona et al. 2008; Peterson et al. 2009). All samples, 223Ra and 224Ra activities, propagated uncertainties and MDAs are provided in the Supplementary Material. We followed the standard practice of applying values of half the MDA to all values below the MDA as opposed to applying zero or the MDA value (Gilbert 1987; Helsel 1990; US EPA 2000). Reported 224Ra values have been adjusted for decay between sample time and analysis, efficiency of each RaDeCC system, background measurements and 228Th activities (Knoll 2010). Note that 224Ra activities are reported as excess 224Ra values hereafter.
Modelling SGD
Radium mass balance. Fluxes of SGD were evaluated using Ra activities and a box model that constrained all input and removal processes for these radionuclides in a coastal water column. We were not able to collect subglacial meltwater, so we assume it has similar tracer composition as the groundwater (and therefore SGD end-member). Quantifying SGD via Ra isotopes inherently includes a recirculated seawater component, so we estimate the freshwater portion of SGD using analytical calculations discussed in the Supplementary Material. Submarine groundwater discharge is calculated based on the Ra isotope activity via modifying existing models (Moore 1996). Surface 224Ra activities and salinities are significantly different than deeper activities; therefore,224Ra activities were applied to a two-box mass balance model (i.e., surface and subsurface),which are summed to obtain one flux measurement at each site. The following calculation is used to determine the SGD balancing excess 224Ra activity in the coastal box (e.g., Krest et al. 2000; Knee et al. 2008; Null et al. 2014):

where


Excess Ra flux (Raex; dpm d−1) is calculated from the average Ra activity in the box (Abox; dpm m−3) not supported by offshore water ca. 1 km outside of the coastal box (Aout; dpm m−3) and therefore supplied from SGD (Eqn. 1). Vbox is the volume of the box (m3). The box is calculated based on a sloping bottom that creates a water prism (de Sieyes et al. 2008). For P8 it is (1060 m ×100 m ×30 m) ÷ 2. The coastal box at P8 was designated based on the topography, coastal bathymetry and the length of the glacier terminus. Because AH is a bay with three sides, it is based on a two-prism calculation from the centre to the sides, as follows: (975 m × 325 m × 32 m) ÷ 2 × 2. Here, τ is the water residence time (d; estimated based on continental shelf current speeds and the box volume; see following). Adecay is the decay of radium activity in dpm d−1 in our coastal box and is calculated via Eqn. 2 using the 224Ra decay constant (λ) of 0.191 d−1. Excess radium flux is then divided by the measured groundwater 224Ra activity end-member (APW; dpm m−3) using Eqn. 3 to obtain a discharge estimate (m3 d−1) required to supply the flux of excess 224Ra. The average of the two highest saline porewater samples was used in the calculation to yield a conservative estimate of SGD. The error of SGD estimates is propagated from the standard deviation of the sample means for each radium source that included the detector efficiency and background. We assume the system is in steady state and that each box (surface and subsurface) is well mixed. The two-box model is based on CTD data, typically showing a gradual to strong halocline and thermocline <1–3 m depth. Unfortunately, the limitations in the methodology of Ra sampling mean that the resolution is not high enough to determine the depth of the “surface box” with Ra activity. We used a surface box of 1 m and everything deeper than 1 m as subsurface to provide a more conservative estimate of SGD. Strong storms may occur and mix the water column, but boating regulations prevented us from sampling during those periods. Because the SGD calculation does not account for desorption of 224Ra from particulates in the freshwater when mixed with seawater, our SGD estimate may be greater than actual fluxes if large amounts of particulates are discharged with groundwater. We assume most particulates are filtered as the meltwater passes through land. Furthermore, lower 228Th was found offshore compared to nearshore water, and therefore this calculation further assumes that there is no production of 224Ra via decay of particulate 228Th in the water. Reported 224Ra activities have been corrected for 228Th supported 224Ra. The uncertainty associated with SGD was estimated following the laws of propagating uncertainty (Taylor & Kuyatt 1994; see Supplementary Material).
Assumptions and other sources of radium. Radium tracers are typically used in marine systems to quantify brackish and recirculated seawater discharge, but here we identify that fresh groundwater (likely subsurface meltwater from the nearby glacier) is enriched in Ra. Radium is typically adsorbed onto particles in freshwater systems unless reducing or low pH conditions exist (Lauria et al. 2004; Gonneea et al. 2008). Oxidation-reduction potential and pH were not measured to identify elevated Ra concentrations in this freshwater system, but it is reasonable to assume low pH conditions may exist based on nearby studies identifying low pH effluents from groundwater along the South Shetlands Islands (Dold et al. 2013). The desorbable fraction from freshwater suspended sediments was also assumed to be a negligible source of Ra based on previous studies (Hwang et al. 2005; Beck et al. 2007).
Diffusion from bottom sediments was not measured and may also be a small source to subsurface waters. Previous studies have demonstrated that in deep water and advective environments, diffusive flux is negligible (Rama & Moore 1996; Charette et al. 2001; Beck et al. 2007). Therefore, we assume bottom sediments contributed an insignificant fraction of Ra to surface water because of greater depths, steep density gradient and rocky bottom along much of the shoreline. Other minor sources of Ra may include icebergs and upwelling (Shaw et al. 2011; Annett et al. 2013). These sources are extremely variable and likely insignificant at our sampling sites during the specified sampling period for the following reasons: no icebergs were present within our sample sites, and upwelling likely occurs farther from the shoreline based on the water column structure. We also assume insignificant contributions from sea ice because sampling was conducted during austral summer with little or no sea ice present in the nearshore during sampling events. Furthermore, glacier ice demonstrated Ra activities on the order of nearshore surface waters and was significantly lower than groundwater Ra activities. It is important to note that the significance of icebergs and calving glacier ice will likely be associated with the amount of particles the iceberg contains, not the ice itself. This is difficult to assess holistically and will be spatially and temporally dependent. Research demonstrating the contribution of short-lived Ra to surface water has been conducted on large tabular icebergs (Shaw et al. 2011), and the significance of calved glacier ice contributing short-lived Ra to surface waters at tidewater glaciers remains elusive, especially on a spatial scale. Furthermore, the limited glacier ice from calving often flowed out of our sampling area quickly without complete melt, suggesting not complete addition of radium to our study zone. Therefore, Ra from ice melt is not included in the SGD calculation, but if significant glacier ice melted within our coastal box contributing radium, then SGD would likely be lower than our estimates.
Lastly, tides are known to influence SGD. We sample across varying tidal stages, and by averaging the radium activities we assume it accounts for the fluctuation of SGD associated with different tidal cycles.
Residence time. Residence times are based on continental shelf surface current speeds of 0.05–0.17 m s−1 (Todoroff et al. 2015), as measured during the austral summer of 2014/15 and presented as a range because exact current speeds could not be monitored for each sample collected in the nearshore during our project duration. The surface current speeds were collected hourly for two months using a high frequency radar network for project CONVERGE (Kohut et al. 2016). We assume the current velocity range accounts for some of the variability we observe in tracer measurements. Current speeds were converted to volumetric flow based on the length of flow path out of the box, 650 m and 100 m for AH and P8, respectively, and 1m depth. We assume uniform current speeds across the surface box, with all outflow occurring at the surface of 1 m depth. Considering the water depth at these locations is shallow, 30 m or less, we assumed our minimum surface velocity would account for the lower subsurface velocities as well. If we assume that most of outflow occurs in the surface at 1–3 m (neglecting tides), using a 3 m depth would decrease the τ by 1/3 and increase SGD flux if all other variables were constant. Therefore, we find it appropriate to use a more conservative estimate of τ. Our assumption is further supported by previous research documenting high outflow occurring within the top 10% of the water column at glacier termini in the Arctic (Rignot et al. 2010). Here, the total volume of the box is divided by the volumetric flow in m3 d−1, providing an estimate of residence time for the model ranging from 1.1 to 3.7 d. For comparison, water age (T), representing the time that has passed since Ra departed the source, is also calculated independently using average activity ratios (AR) of 224Ra and 223Ra following Moore (2000):

This calculation assumes Ra flux is localized from the coastline.
Results
The parameters used in the model can be distinguished based on salinity and Ra activities (Table 1, Fig. 2). The nearshore water column showed significant differences in surface and subsurface water for salinity and Ra. Salinity was significantly lower in surface water than subsurface water at both sites (p = 0.0071 and p = 0.0095, respectively). Surface water salinity ranged from 16.8 to 34.5, with averages of 31.3 ± 0.7 and 33.0 ± 0.2 at AH and P8, respectively, and subsurface water salinity averages were 33.0 ± 0.5 and 33.8 ± 0.5 at AH and P8, respectively. Groundwater (ca. 1.5 m depth) was fresh with an average salinity of 0.0 and 1.20 ± 0.1 at AH and P8, respectively. The highest salinity in groundwater measured at P8 was 9.20 during a high tide. The average salinity of waters offshore (outside of our coastal box) was significantly different than nearshore salinities, with an average of 34.4 ± 0.0 (p < 0.0001).
Table 1 Average values and standard error for salinity, 224Ra, 223Ra, and 224Ra/223Ra activity ratio at AH and P8. Averages do not include samples below detection limit. n reflects the number of radium samples. Nearshore water column is the average for the entire water column and then divided into surface (ca. 1 m depth) and subsurface water (>1 m depth) averages. “Offshore” refers to samples immediately outside our coastal box, and ice melt samples include melted glacier ice samples and meltwater “waterfalls” occurring at the glacier terminus.
| Site |
End-member |
n |
Salinity |
224Ra (dpm m−3) |
223Ra (dpm m−3) |
Activity ratio |
| AH |
Groundwater |
4 |
0.010 |
58.9 ± 29.9 |
3.4 ± 1.9 |
31.6 ± 41.0 |
|
Surface runoff |
5 |
0 |
69.5 ± 60.0 |
3.9 ± 2.0 |
21.4 ± 7.35 |
|
Nearshore |
62 |
31.8 ± 0.9 |
9.96 ± 5.84 |
0.76 ± 0.43 |
15.1 ± 10.2 |
|
Nearshore (surface) |
40 |
31.3 ± 0.7 |
10.9 ± 6.28 |
0.81 ± 0.48 |
16.3 ± 11.5 |
|
Nearshore (subsurface) |
22 |
33.0 ± 0.5 |
8.14 ± 4.53 |
0.69 ± 0.30 |
12.8 ± 7.01 |
| P8 |
Groundwater |
35 |
1.20 ± 0.1 |
81.1 ± 135 |
2.4 ± 4.3 |
38.9 ± 27.7 |
|
Surface runoff |
0 |
– |
– |
– |
– |
|
Nearshore |
60 |
33.0 ± 0.1 |
6.92 ± 4.66 |
0.64 ± 0.39 |
13.2 ± 10.6 |
|
Nearshore (surface) |
49 |
33.0 ± 0.2 |
7.56 ± 4.89 |
0.67 ± 0.39 |
14.3 ± 11.1 |
|
Nearshore (subsurface) |
11 |
33.8 ± 0.5 |
4.02 ± 1.98 |
0.52 ± 0.22 |
8.78 ± 6.53 |
| Other |
Offshore |
6 |
34.38 ± 0.04 |
3.30 ± 0.85 |
0.56 ± 0.17 |
6.30 ± 2.11 |
|
Ice melt |
4 |
0 |
8.51 ± 9.50 |
0.71 ± 0.60 |
11.0 ± 5.60 |

Fig. 2 224Ra versus salinity of different source waters including all samples from AH and P8. Inset shows Salinity-224Ra of offshore and nearshore samples (subdivided into surface and subsurface) on a smaller scale. Error bars represent propagated uncertainties associated with each sample measurement.
When considering all Ra activities regardless of site, the 224Ra and 223Ra activities were significantly higher in samples from groundwater compared to nearshore surface water, with 79.5 and 2.48 dpm m−3 for average groundwater 224Ra and 223Ra, respectively, and average nearshore 224Ra and 223Ra activities of 8.46 and 0.70, respectively (p < 0.0001). Radium-224 was significantly higher in surface water compared to subsurface water at both sites, supporting poor mixing of the water column and the two-box model approach. However, 223Ra was not significantly different between surface and subsurface (Table 1). Groundwater 224Ra and 223Ra activities ranged from 3.30 to 769 dpm m−3 and below detection limit 24.2 dpm m−3, respectively, with analytical uncertainties of 0.19–3.3 dpm m−3 for 223Ra and 0.78–23 dpm m−3 for 224Ra. Radium-224 showed significantly higher activities closer to shore (8.46 dpm m−3) compared to offshore samples (3.30 dpm m−3; p = 0.0011), although there was not a significant linear decrease with distance from shore within the nearshore zone (<1 km), possibly from the dynamic influence of the extensive meltwater plume. Radium-224 activities in subsurface waters were significantly lower than surface water activities at both sites (Table 1; AH: p = 0.0051; P8: p = 0.0031). Mean 224Ra and 223Ra activities in surface waters differed between sampling sites, with higher activities at AH (Table 1; p = 0.0002). The activity ratio was also significantly different between the sites (p = 0.0294) and between radium sources (Table 1). Radium-224 activity in glacier ice samples ranged from 2.07 to 23.5 dpm m−3 and possibly as high as 24.6 dpm m−3 when considering the analytical uncertainty.
Parameters used in the Ra-based SGD calculation (Eqns. 1–3) and the SGD results for each site are listed in Table 2. Submarine groundwater discharge rate estimates (±propagated error) using 224Ra resulted in a combined surface and subsurface discharge of (4.89 ± 1.3)×104–(11.5 ± 3.0)×104m3 d−1(median [8.20 ± 2.2]×104m3 d−1) at AH and (0.24 ± 0.08)×104–(0.57 ± 0.19)×104 m3 d−1(median [0.41 ± 0.14]×104m3 d−1) at P8. The reported ranges of discharge estimates are based on the values calculated from using the highest and lowest residence times in the Ra mass balance model, and the error of each value is propagated following the laws of propagating uncertainty. The variability of residence time and variability among samples produces a conservative range and error of SGD. Again, the SGD term includes recirculated seawater, subglacial discharge and surface runoff that has extensive water–rock interaction, and results assume steady-state conditions for the purpose of this study. Furthermore, we completed the calculation by increasing the surface layer depth and found that with a 2-m surface box the median SGD only increases from 8.2×10⁴ to 8.4×10⁴ at AH, well within the error. The surface layer is variable, and our approach of using the 1-m surface box based on CTD deployments is a conservative approach because higher Ra activities were found in the surface.
Table 2 Values used to calculate SGD to the coastal ocean: values for volume (Vbox) and 224Ra activities for the nearshore coastal zone (Abox), groundwater (Apw), outside the coastal box (Aout). The residence time is represented by τ. The different residence times were used to calculate SGD, and therefore SGD is presented as the median values for each box (surface and subsurface).
| Site |
Sample |
Vbox |
Vbox |
Abox |
Abox |
Apw |
Apw |
Aout |
Aout |
τ |
Coastline |
SGD |
|
Depth |
(m3) |
Unc. |
(dpm m−3) |
Unc. |
(dpm m−3) |
Unc. |
(dpm m−3) |
Unc. |
(d) |
(m) |
(×103 m3 d−1) |
| AH |
Surface |
316 875 |
31 687 |
10.9 |
6.29 |
558 |
135 |
2.48 |
0.85 |
1.1–3.6 |
2921 |
3.8 ± 1.0 |
|
Subsurface |
9 823 125 |
982 312 |
8.14 |
4.53 |
558 |
135 |
2.48 |
0.85 |
1.1–3.6 |
2921 |
78 ± 22 |
| P8 |
Surface |
106 000 |
10 600 |
8.29 |
4.91 |
558 |
135 |
2.48 |
0.85 |
1.1–3.7 |
1060 |
0.75 ± 0.2 |
|
Subsurface |
1 537 000 |
153 700 |
3.84 |
2.05 |
558 |
135 |
2.48 |
0.85 |
1.1–3.7 |
1060 |
3.3 ± 1.3 |
Discussion
Radium has been used as a valuable tracer along the WAP to delineate water masses on the continental shelf (Charette et al. 2007; Dulaiova et al. 2009; Annett et al. 2013; Corbett et al. 2017), and here we use it to trace water from across the seafloor to the ocean and quantify groundwater discharge. Enriched Ra activities in surface water near Palmer Station are similar to Ra activities found at other locations along the WAP (Table 3). Nearshore 224Ra has been found to be statistically higher than more distant surface water at other glacier termini, such as in Ryder Bay, and meltwater may be a source of radium and micro- and macro-nutrients (Annett et al. 2013). Dulaiova et al. (2009) and Charette et al. (2007) demonstrated that rapid lateral transport (as opposed to vertical flux) in the seaward direction from the continental shelf and/or land is important for transferring dissolved iron and other nutrients offshore. Surface runoff or sediments from land was hypothesized as fuelling austral summer phytoplankton blooms near the Crozet Islands (Charette et al. 2007). These other studies suggest that enriched radium nearshore likely originates from land, and here we build on these previous hypotheses by quantifying the meltwater pathway from land as SGD. Radium is elevated in groundwater compared to surface waters near Palmer Station, making it a valuable groundwater tracer in this glacial setting. In addition, excess Ra in surface waters near Palmer Station suggest SGD is occurring along the WAP near glacier termini.
Table 3 Comparison of Ra activities to other studies conducted in Antarctica. “Below the detection limit” is abbreviated to “bdl”.
| Study |
Site |
Distance (km) |
224Ra (dpm m−3) |
223Ra (dpm m−3) |
|
Charette et al. 2007 |
Crozet Islands |
0 |
47 |
5.2 |
|
|
1.3 |
21 |
1.16 |
|
|
14.7 |
0.34 |
bdl |
|
Dulaiova et al. 2009 |
South Shetland Islands |
<0.1 |
8–17 |
NA |
|
|
Shelf |
2–4 |
NA |
|
Annett et al. 2013 |
Marguerite Bay |
0.1 |
14.6 |
0.64 |
|
|
0.1–1.0 |
1.12–2.95 |
0.039–0.25 |
|
|
>1.0 |
0.066–4.48 |
bdl-0.006 |
| This study |
Anvers Island |
0–0.1 |
8.06–31.43 |
bdl-2.68 |
|
|
>1.0 |
0.44 - 4.44 |
bdl-0.66 |
|
|
Shelf |
0.11–9.68 |
bdl-0.66 |
The estimates of SGD in this study represent discharge during austral summer, likely at peak glacial meltwater and discharge conditions. We do not extrapolate and compare to other annual freshwater fluxes because our summer discharge applied annually would likely overestimate an annual flux. However, our estimates are comparable to East Antarctic SGD estimates in Lutzow-Holm Bay. We applied the minimum and maximum SGD rates measured by Uemura et al. (2011) using seepage meters in East Antarctica to our study areas for comparison. Uemura et al. (2011) found SGD rates of (0.73–8.3)×10−2 m d−1 in East Antarctica, which results in a flux of (4.6–52)×103 m3 d−1 and (0.78–8.8)×103 m3 d−1 when applied to the areas of AH and P8, respectively. These ranges fall within our results of (48.9–112)×103 m3 d−1 and (2.4–5.6)×103 m3 d−1 at AH and P8, respectively. Our results may have a slightly higher discharge, especially at AH, than Uemura et al. (2011), for the following reasons: we consider a different location with different glacier dynamics; we sample closer to shore; we include subglacial discharge and diffuse runoff in our discharge result; and/or our studies have inherent differences in methodology. Uemura et al. (2011) conducted direct SGD measurements using continuous-heat type seepage meters at discrete points ranging from 12 m to 665 m water depth, whereas we use groundwater tracers, which integrate over space and time to estimate discharge rates. Furthermore, to corroborate our 224Ra-based SGD results, we find similar rates using 223Ra-based calculations (Supplementary Table S1). Both studies demonstrate that SGD is occurring in Antarctica, so it is likely not a local phenomenon, and that groundwater discharges occur nearshore and also farther on the shelf in deeper water.
Our results match well with other studies conducted in Antarctica; nevertheless certain assumptions, including residence time and the aforementioned caveats, can impact the SGD flux estimates. A simple sensitivity analysis showed that by increasing the radium activity by a factor of two in surface waters, the SGD increases by an order of magnitude. Furthermore, we used a conservative groundwater end-member value (558 dpm m−3; the average of the two highest activities measured). By using this end-member, we can demonstrate the potential significance of SGD. Any decrease in the activity of the groundwater end-member would lead to an increase in the calculated rate of discharge. For example, if we calculate SGD based on the average groundwater activity (74.5 dpm m−3), SGD increases to (0.3–8.6 ± 1.7)×105m3 d−1. Furthermore, variable current speeds throughout the water column could not be determined for every sampling day at each site, and therefore we use a wide range to encompass a variety of conditions. A reasonable assumption is that the current speeds during our sampling period were similar to the current speeds measured during austral summer 2014. To determine if our assumptions are valid, we calculate the water age of the coastal zone using radium isotopes (Eqn. 4). The water ages of 5.3 and 6.5 d for AH and P8, respectively, are similar to our estimates of residence times for both sites, providing additional confidence regarding our residence time calculation. The heterogeneity in groundwater measurements and current speeds likely represents large uncertainties in the estimates. This uncertainty in the results should be considered in further studies.
Freshwater vs. recirculated seawater
Recirculated seawater fluxes are calculated using analytical calculations for wave and tidal pumping (Longuet-Higgins et al. 1983; Li et al. 1999; de Sieyes et al. 2011; Null et al. 2014) to estimate the fractions of fresh and saline water components of SGD (see Supplementary Material). Recirculated seawater is estimated to be (1.2–4.2)×103 m3 d−1 for each site, accounting for variability in tides (i.e., semi-diurnal and diurnal) and site (see Supplementary Material). The average recirculated seawater discharge at each site was subtracted from the total SGD discharge to volumetrically estimate the freshwater portion of SGD in m3 d−1. These calculations do not account for density-driven circulation, which operates over larger areas and longer timescales than this study (Robinson, Li & Barry 2007; Robinson, Li & Prommer 2007). The results from calculating wave and tidal pumping suggest that recirculated seawater comprises 3%–9% at AH and 20%–63% at P8; therefore, a vast majority of the SGD is freshwater. This is not surprising based on our observations of the rapidly melting glacier during the summer. In some environments, recirculated seawater may comprise 70% or more of SGD (Li et al. 1999; Burnett et al. 2003; Smith 2004). P8 likely has more recirculated seawater because of the bathymetry (more gradual slope) compared to the steep cliffs at AH and the glacial topography (Shibuo et al. 2006; Fig. 1b, c). Our study suggests that a significant portion of meltwater infiltrates into the land and is likely discharged to coastal waters along the WAP. This study focused on discharge to the nearshore environment within ca. 100 m of land and did not investigate discharge occurring from deeper groundwater systems farther from shore (DeFoor et al. 2011; Uemura et al. 2011).
The SGD results from this study using a Ra mass balance are greater than many other SGD studies worldwide at the local scale (ca. 1 km; 1–200 m3 m−1 d−1) and regional scale (100–6000 m3 m−1 d−1; Charette et al. 2008; Moore 2010). Our large discharge estimates with substantial portion of freshwater indicate that groundwater and subglacial discharge may play an important role in the total freshwater delivery to the coastal ocean near glacier termini (Fig. 3).The total freshwater flux (all freshwater regardless of source including calving, etc.) to the nearshore coastal box was calculated using the following equation:

Fig. 3 Flux of total freshwater based on salinity mass balance (Total FW), freshwater portion of subglacial-submarine groundwater discharge (SGD FW) and recirculated seawater (RSW) in m3 d−1 at AH and P8. Note the scale differences for each graph.
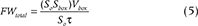
Sois the average salinity outside the box (<1 km beyond the coastal box towards offshore water). The average salinity and volume of the coastal box are Sboxand Vbox(m3), respectively. Salinity values used in the mass balance are listed in Table 1. Conducting a simple salinity mass balance using average salinity values and the same residence times and volumes for each site as in the Ra mass balance model demonstrates a large flux of freshwater to the nearshore zone:ca. 2.5×10⁵m3 d−1 of total freshwater contribution at AH and ca. 0.17×10⁵m3 d−1 at P8. This suggests that the majority of SGD is freshwater and contributes up to 32% of the total freshwater to the coastal environment near Palmer Station (Fig. 3). Our visual observations of meltwater distribution at the glacier terminus suggest a significant portion of meltwater is infiltrated into the land and likely discharged to the coastal ocean as groundwater. Clearly, future work is needed to separate these hydrologic components.
Conclusion
Submarine groundwater discharge is a volumetrically significant, previously unquantified hydrologic process occurring in the nearshore environment along the WAP at a tidewater glacier. This study identifies that SGD is occurring and suggests that it can play a significant role in water mass balance and geochemical budgets. Although glacial discharge likely varies over time and space, our estimates provide a first-order approximation of austral summer SGD by averaging weekly Ra concentrations at two sites to presumably encompass the range in Ra flux and ultimately SGD. It is important to consider SGD, delineated between freshwater and seawater fluxes, to understand land–sea interactions, water balance and chemical budgets in coastal environments. This study provides the first SGD measurement along the WAP and valuable insight about the potential flow paths of glacial meltwater. This knowledge can be useful for determining water mass fluxes and highlights the need to better understand the impact of climate change on glacier retreat, subsurface hydrology and the impact on the physical/chemical behaviours of the coastal ocean.
Acknowledgements
The authors thank the Antarctic Support Contract and crew aboard the Laurence M. Gould for technical assistance during field campaigns. The authors also thank J.P. Walsh, R. Viso, D. Young, D. Hawkins and I. Conery for assistance in the field. The authors thank the anonymous reviewers for providing insightful suggestions to improve this manuscript.
Author contributions
KAN, DRC and WBL designed the research. KAN, DRC, JC, RP, LP, CSB and WBL collected and analysed the samples. KAN and DRC analysed the data and wrote the paper. All authors contributed to edits of the paper.
References
Annett A.L., Henley S.F., Van Beek P., Souhaut M., Ganeshram R., Venables H.J., Meredith M.P. & Geibert W. 2013. Use of radium isotopes to estimate mixing rates and trace sediment inputs to surface waters in northern Marguerite Bay, Antarctic Peninsula. Antarctic Science 25, 445–456, http://dx.doi.org/10.1017/S0954102012000892.
Bartholomaus T.C., Amundson J.M., Walter J.I., O’Neel S., West M.E. & Larsen C.F. 2015. Subglacial discharge at tidewater glaciers revealed by seismic tremor. Geophysical Research Letters 42, 6391–6398, http://dx.doi.org/10.1002/2015GL064590.
Beck A.J., Rapaglia J.P., Cochran J.K. & Bokuniewicz H.J. 2007. Radium mass-balance in Jamaica Bay, NY: evidence for a substantial flux of submarine groundwater. Marine Chemistry, 106, 419–441, http://dx.doi.org/10.1016/j.marchem.2007.03.008.
Beusen A.H.W., Slomp C.P. & Bouwman A.F. 2013. Global land–ocean linkage: direct inputs of nitrogen to coastal waters via submarine groundwater discharge. Environmental Research Letters 8(3), article no. 034035, http://dx.doi.org/10.1088/1748-9326/8/3/034035.
Brown G.H., Sharp M. & Tranter M. 1996. Subglacial chemical erosion: seasonal variations in solute provenance, Haut Glacier d’Arolla, Valais, Switzerland. Annals of Glaciology 22, 25–31, http://dx.doi.org/10.3189/1996AoG22-1-25-31.
Burnett W.C., Aggarwal P.K., Aureli A., Bokuniewicz H., Cable J.E., Charette M.A., Kontar E., Krupa S., Kulkarni K.M., Loveless A. & Moore W.S. 2006. Quantifying submarine groundwater discharge in the coastal zone via multiple methods. Science of the Total Environment 367, 498–543, http://dx.doi.org/10.1016/j.scitotenv.2006.05.009.
Burnett W.C., Bokuniewicz H., Huettel M., Moore W.S. & Taniguchi M. 2003. Groundwater and porewater inputs to the coastal zone. Biogeochemistry 66, 3–33.
Burnett W.C. & Dulaiova H. 2003. Estimating the dynamics of groundwater input into the coastal zone via continuous radon-222 measurements. Journal of Environmental Radioactivity 69, 21–35, http://dx.doi.org/10.1016/S0265-931X(03)00084-5.
Charette M.A., Buesseler K.O. & Andrews J.E. 2001. Utility of radium isotopes for evaluating the input and transport of groundwater-derived nitrogen to a Cape Cod estuary. Limnology and Oceanography 46, 465–470, http://dx.doi.org/10.4319/lo.2001.46.2.0465.
Charette M.A., Gonneea M.E., Morris P.J., Statham P., Fones G., PlanquetteH., Salter I. & Garabato A.N. 2007. Radium isotopes as tracers of iron sources fueling a Southern Ocean phytoplankton bloom. Deep-Sea Research Part II 54, 1989–1998, http://dx.doi.org/10.1016/j.dsr2.2007.06.003.
Charette M.A., Moore W.S. & Burnett W.C. 2008. Uranium-and thorium-series nuclides as tracers of submarine groundwater discharge. Radioactivity in the Environment 13, 155–191.
Christoffersen P., Bougamont M., Carter S.P., Fricker H.A. & Tulaczyk S. 2014. Significant groundwater contribution to Antarctic ice streams hydrologic budget. Geophysical Research Letters 41, 2003–2010, http://dx.doi.org/10.1002/2014GL059250.
Cook A.J., Fox A.J., Vaughan D.G. & Ferrigno J.G. 2005. Retreating glacier fronts on the Antarctic Peninsula over the past half-century. Science 308, 541–544, http://dx.doi.org/10.1126/science.1104235.
Cook A.J., Holland P.R., Meredith M.P., Murray T., Luckman A. & Vaughan D.G. 2016. Ocean forcing of glacier retreat in the western Antarctic Peninsula. Science 353, 283–286, http://dx.doi.org/10.1126/science.aae0017.
Corbett D.R., Chanton J., Burnett W., Dillon K., Rutkowski C. & Fourqurean J.W. 1999. Patterns of groundwater discharge into Florida Bay. Limnology and Oceanography 44, 1045–1055, http://dx.doi.org/10.4319/lo.1999.44.4.1045.
Corbett D.R., Crenshaw J., Null K., Peterson R.N., Peterson L.E. & Lyons W.B. 2017. Nearshore mixing and nutrient delivery along the western Antarctic Peninsula. Antarctic Science 29, 397–409, http://dx.doi.org/10.1017/S095410201700013X.
Currie L.A. 1968. Limits for qualitative detection and quantitative determination. Analytical Chemistry 40, 586–593.
DeFoor W., Person M., Larsen H.C., Lizarralde D., Cohen D. & Dugan B. 2011. Ice sheet–derived submarine groundwater discharge on Greenland’s continental shelf. Water Resources Research 47, W07549, http://dx.doi.org/10.1029/2011WR010536.
de Sieyes N.R, Yamahara K.M., Layton B.A., Joyce E.H. & Boehm A.B. 2008. Submarine discharge of nutrient-enriched fresh groundwater at Stinson Beach, California is enhanced during neap tides. Limnology and Oceanography 53, 1434–1445, http://dx.doi.org/10.4319/lo.2008.53.4.1434.
Dierssen H.M., Smith R.C. & Vernet M. 2002. Glacial meltwater dynamics in coastal waters west of the Antarctic peninsula. Proceedings of the National Academy of Sciences 99, 1790–1795, http://dx.doi.org/10.1073/pnas.032206999.
Dold B., Gonzalez-Toril E., Aguilera A., Lopez-Pamo E., Cisternas M.E., Bucchi F. & Amils R. 2013. Acid rock drainage and rock weathering in Antarctica: important sources for iron cycling in the Southern Ocean. Environmental Science &Technology 47, 6129–6136, http://dx.doi.org/10.1021/es305141b.
Dulaiova H., Ardelan M.V., Henderson P. B. & Charette M.A. 2009. Shelf-derived iron inputs drive biological productivity in the southern Drake Passage. Global Biogeochemical Cycles 23, GB4014, http://dx.doi.org/10.1029/2008GB003406.
Garcia-Solsona E., Garcia-Orellana J., Masqué P. & Dulaiova H. 2008. Uncertainties associated with 223Ra and 224Ra measurements in water via a delayed coincidence counter (RaDeCC). Marine Chemistry 109, 198–219, http://dx.doi.org/10.1016/j.marchem.2007.11.006.
Garibotti I.A., Vernet M., Ferrario M.E., Smith R.C., Ross R.M. & Quetin L.B. 2003. Phytoplankton spatial distribution patterns along the western Antarctic Peninsula (Southern Ocean). Marine Ecology Progress Series 261, 21–39, http://dx.doi.org/10.3354/meps261021.
Gilbert R.O. 1987. Statistical methods for environmental pollution monitoring. New York: Van Nostrand Rheinhold Co.
Gonneea M.E., Morris P.J., Dulaiova H. & Charette M.A. 2008. New perspectives on radium behavior within a subterranean estuary. Marine Chemistry 109, 250–267, http://dx.doi.org/10.1016/j.marchem.2007.12.002.
Helsel D.R. 1990. Less than obvious; statistical treatment of data below the detection limit. Environmental Science and Technology 24, 1767–1774, http://dx.doi.org/10.1021/es00082a001.
Hodson A., Heath T., Langford H. & Newsham K. 2010. Chemical weathering and solute export by meltwater in a maritime Antarctic glacier basin. Biogeochemistry 98, 9–27, http://dx.doi.org/10.1007/s10533-009-9372-2.
Hodgkins R., Tranter M. & Dowdeswell J.A. 1997. Solute provenance, transport and denudation in a High Arctic glacierized catchment. Hydrological Processes 11, 1813–1832, http://dx.doi.org/10.1002/(SICI)1099-1085(199711)11:14<1813::AID-HYP498>3.0.CO;2-C.
Hwang D.W., Kim G., Lee Y.W. & Yang H.S. 2005. Estimating submarine inputs of groundwater and nutrients to a coastal bay using radium isotopes. Marine Chemistry 96, 61–71, http://dx.doi.org/10.1016/j.marchem.2004.11.002.
Knee K.L., Layton B.A., Street J.H., Boehm A.B. & Paytan A. 2008. Sources of nutrients and fecal indicator bacteria to nearshore waters on the north shore of Kauai (Hawaii, USA). Estuaries and Coasts 31, 607–622, http://dx.doi.org/10.1007/s12237-008-9055-6.
Knoll G.F. 2010. Radiation detection and measurement. New York: John Wiley & Sons.
Kohut J., Miles T., Bernard K., Fraser W., Patterson-Fraser D., Oliver M., Cimino M., Winsor P., Statscewich H. & Fredj E. 2016. Project CONVERGE: impacts of local oceanographic processes on Adélie penguin foraging ecology. http://dx.doi.org/10.1109/OCEANS.2016.7761152 In: Oceans 2016 MTS/IEEE Monterey. Piscataway, NJ: Institute of Electrical and Electronic Engineers.
Krest J.M., Moore W.S., Gardner L.R. & Morris J.T. 2000. Marsh nutrient export supplied by groundwater discharge: evidence from radium measurements. Global Biogeochemical Cycles 14, 167–176, http://dx.doi.org/10.1029/1999GB001197.
Lauria D.C., Almeida R.M.R. & Sracek O. 2004. Behavior of radium, thorium and uranium in groundwater near the Buena Lagoon in the coastal zone of the state of Rio de Janeiro, Brazil. Environmental Geology 47, 11–19, http://dx.doi.org/10.1007/s00254-004-1121-1.
Li L., Barry D.A., Stagnitti F. & Parlange J. 1999. Submarine groundwater discharge and associated chemical input to a coastal sea. Water Resources Research 35, 3253–3259, http://dx.doi.org/10.1029/1999WR900189.
Longuet-Higgins M.S. 1983. Wave set-up, percolation and undertow in the surf zone. Proceedings of the Royal Society of London Series A 390, 283–291, http://dx.doi.org/10.1098/rspa.1983.0132.
Lyons W.B., Welch K.A., Carey A.E., Doran P.T., Wall D.H., Virginia R.A., Fountain A.G., Csathó B.M. & Tremper C.M. 2005. Groundwater seeps in Taylor Valley Antarctica: an example of a subsurface melt event. Annals of Glaciology 40, 200–206, http://dx.doi.org/10.3189/172756405781813609.
Michael H.A., Mulligan A.E. & Harvey C.F. 2005. Seasonal oscillations in water exchange between aquifers and the coastal ocean. Nature 436, 1145–1148, http://dx.doi.org/10.1038/nature03935.
Moore W.S. 1996. Large groundwater inputs to coastal waters revealed by 226Ra enrichments. Nature 380, 612–614, http://dx.doi.org/10.1038/380612a0.
Moore W.S. 2000. Ages of continental shelf water determined from 223Ra and 224Ra. Journal of Geophysical Research—Oceans 105, 22117–22122, http://dx.doi.org/10.1029/1999JC000289.
Moore W.S. 2010. The effect of submarine groundwater discharge on the ocean. Annual Review of Marine Science 2, 59–88, http://dx.doi.org/10.1146/annurev-marine-120308-081019.
Moore W.S. & Arnold R. 1996. Measurement of 223Ra and 224Ra in coastal waters using a delayed coincidence counter. Journal of Geophysical Research—Oceans 101, 1321–1329, http://dx.doi.org/10.1029/95JC03139.
Moore W.S. & Reid D.F. 1973. Extraction of radium from natural waters using manganese-impregnated acrylic fibers. Journal of Geophysical Research 78, 8880–8886, http://dx.doi.org/10.1029/JC078i036p08880.
Null K.A., Knee K.L., Crook E.D., de Sieyes N.R., Rebolledo-Vieyra M., Hernández-Terrones L. & Paytan A. 2014. Composition and fluxes of submarine groundwater along the Caribbean coast of the Yucatan Peninsula. Continental Shelf Research 77, 38–50, http://dx.doi.org/10.1016/j.csr.2014.01.011.
Paytan A., Shellenbarger G.G., Street J.H., Gonneea M.E., Davis K., Young M.B. & Moore W.S. 2006. Submarine groundwater discharge: an important source of new inorganic nitrogen to coral reef ecosystems. Limnology and Oceanography 51, 343–348, http://dx.doi.org/10.4319/lo.2006.51.1.0343.
Peterson R.N., Burnett W.C., Dimova N. & Santos I.R. 2009. Comparison of measurement methods for radium-226 on manganese-fiber. Limnology and Oceanography: Methods 7, 196–205, http://dx.doi.org/10.4319/lom.2009.7.196.
Rama M.W.S. & Moore W.S. 1996. Using the radium quartet for evaluating groundwater input and water exchange in salt marshes. Geochimica et Cosmochimica Acta 60, 4645–4652, http://dx.doi.org/10.1016/S0016-7037(96)00289-X.
Rejcek P. 2014. Island time: latest glacier calving near Palmer Station reveals another separate land area. The Antarctic Sun. Accessed on the internet athttp://antarcticsun.usap.gov /science/content handler.cfm?id=3003 on 15 February.
Rignot E., Casassa G., Gogineni S., Kanagaratnam P., Krabill W., Pritchard H., Rivera A., Thomas R., Turner J. & Vaughan D. 2005. Recent ice loss from the Fleming and other glaciers, Wordie Bay, West Antarctic Peninsula. Geophysical Research Letters 32, http://dx.doi.org/10.1029/2004GL021947.
Rignot E., Koppes M., & Velicogna I. 2010. Rapid submarine melting of the calving faces of west Greenland glaciers. Nature Geoscience 3, 187–191, http://dx.doi.org/10.1038/NGEO765
Robinson C., Li L. & Barry D.A. 2007. Effect of tidal forcing on a subterranean estuary. Advances in Water Resources 30, 851–865, http://dx.doi.org/10.1016/j.advwatres.2006.07.006.
Robinson C., Li L. & Prommer H. 2007. Tide-induced recirculation across the aquifer–ocean interface. Water Resources Research 43, W07428, http://dx.doi.org/10.1029/2006WR005679.
Shaw T.J., Raiswell R., Hexel C.R., Vu H.P., Moore W.S., Dudgeon R. & Smith K.L. 2011. Input, composition, and potential impact of terrigenous material from free-drifting icebergs in the Weddell Sea. Deep-Sea Research Part II 58,1376–1383, http://dx.doi.org/10.1016/j.dsr2.2010.11.012.
Shibuo Y., Jarsjö J. & Destouni G. 2006. Bathymetry-topography effects on saltwater–fresh groundwater interactions around the shrinking Aral Sea. Water Resources Research 42, W11410, http://dx.doi.org/10.1029/2005WR004207.
Slomp C.P. & Van Cappellen P. 2004. Nutrient inputs to the coastal ocean through submarine groundwater discharge: controls and potential impact. Journal of Hydrology 295, 64–86, http://dx.doi.org/10.1016/j.jhydrol.2004.02.018.
Smith A.J. 2004. Mixed convection and density-dependent seawater circulation in coastal aquifers. Water Resources Research 40, W08309, http://dx.doi.org/10.1029/2003WR002977
Taniguchi M., Burnett W.C., Cable J.E. & Turner J.V. 2002. Investigation of submarine groundwater discharge. Hydrological Processes 16, 2115–2129, http://dx.doi.org/10.1002/hyp.1145.
Taniguchi M., Ishitobi T. & Shimada J. 2006. Dynamics of submarine groundwater discharge and freshwater–seawater interface. Journal of Geophysical Research—Oceans 111, C01008, http://dx.doi.org/10.1029/2005JC002924.
Taylor B.N. & Kuyatt C.E. 1994. Guidelines for evaluating and expressing the uncertainty of NIST measurement results. NIST Technical Note 1297. Gaithersburg, MD: Physics Laboratory, National Institute of Standards and Technology.
Todoroff K., Kohut J., Winsor P. & Statscewich H. 2015. Spatial circulation patterns over Palmer Deep Canyon and the effects on Adélie penguin foraging. http://dx.doi.org/10.23919/OCEANS.2015.7404438. In: Oceans 2015 MTS/IEEE Washington. Piscataway, NJ: Institute of Electrical and Electronic Engineers.
Uemura T., Taniguchi M. & Shibuya K. 2011. Submarine groundwater discharge in Lützow-Holm Bay, Antarctica. Geophysical Research Letters 38, L08402, http://dx.doi.org/10.1029/2010GL046394.
US EPA 2000. Guidance for data quality assessment. Practical methods for data analysis. EPA QA/G-9. QA00. Washington, DC: US Environmental Protection Agency, Office of Environmental Information.